Unlock a world of possibilities! Login now and discover the exclusive benefits awaiting you.
- Qlik Community
- :
- Forums
- :
- Analytics & AI
- :
- Products & Topics
- :
- Visualization and Usability
- :
- Need Help Displaying Targets vs Actuals
- Subscribe to RSS Feed
- Mark Topic as New
- Mark Topic as Read
- Float this Topic for Current User
- Bookmark
- Subscribe
- Mute
- Printer Friendly Page
- Mark as New
- Bookmark
- Subscribe
- Mute
- Subscribe to RSS Feed
- Permalink
- Report Inappropriate Content
Need Help Displaying Targets vs Actuals
Hi everyone,
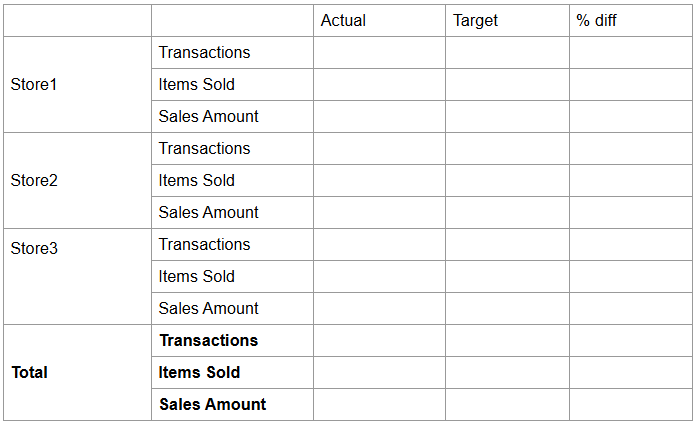
I have daily target data for each store – including targets for number of transactions, number of items sold, and total sales amount. I want to compare these targets with the actual performance data. So in total, I’m dealing with 6 measures (3 targets and 3 actuals).
I’d like to present this in a pivot table (or another object) so I can clearly compare actuals vs. targets, and calculate the differences. The layout I’m aiming for looks something like shown in the attached image.
However, I’m having trouble implementing this using the standard pivot table in Qlik Sense.
I’d really appreciate any suggestions or alternative approaches for achieving this kind of comparison.
Thanks in advance!
Accepted Solutions
- Mark as New
- Bookmark
- Subscribe
- Mute
- Subscribe to RSS Feed
- Permalink
- Report Inappropriate Content
Hi, true, sorry, to show totals the inline table can be used as the columns dimension
LOAD * Inline [
IdSalesMeasure,SalesMeasure
1,Actual
2,Target
3,% diff
]
And set the values as rows, using 3 different measures, in example, for transactions:
Pick(IdSalesMeasure
  ,$(TransactionsActual)
  ,$(TransactionsTarget)
  ,$(TransactionsPercDiff)
)
- Mark as New
- Bookmark
- Subscribe
- Mute
- Subscribe to RSS Feed
- Permalink
- Report Inappropriate Content
Hi, 'Cost/Quantity/Cost per Unit' is not shown in the initial image, that is Transactions/Items Sold/Sales Amount?
In that case, don't set it as dimension, use 3 different measures. I posted the Transactions measure as an example, it will need to add another 2 measures: for Items Sold and for Sales Amount.
So Store as horizontal dimension, Actual/Budget/Diff as vertical dimension, and 3 different measures, setting the Values as rows instead of columns.
- Mark as New
- Bookmark
- Subscribe
- Mute
- Subscribe to RSS Feed
- Permalink
- Report Inappropriate Content
Hi, the approach vould be differnt based on data model and volume of data, but a soultion could be:
1- Create an Island table for the measures:
LOAD * Inline [
IdSalesMeasure,SalesMeasure
1,Transactions
2,Items Sold
3,Sales Amoun
]
Add as dimension, and set the expressions for real, target and % diff with a syntax like:
Pick(IdSalesMeasure
  ,$(TransactionsExpression)
  ,$(ItemsSoldExpression)
  ,$(SalesAmountExpression)
)
- Mark as New
- Bookmark
- Subscribe
- Mute
- Subscribe to RSS Feed
- Permalink
- Report Inappropriate Content
Thank you very much for the help.
It works well for me except for the fact that it doesn't display a totals row.
- Mark as New
- Bookmark
- Subscribe
- Mute
- Subscribe to RSS Feed
- Permalink
- Report Inappropriate Content
Hi, true, sorry, to show totals the inline table can be used as the columns dimension
LOAD * Inline [
IdSalesMeasure,SalesMeasure
1,Actual
2,Target
3,% diff
]
And set the values as rows, using 3 different measures, in example, for transactions:
Pick(IdSalesMeasure
  ,$(TransactionsActual)
  ,$(TransactionsTarget)
  ,$(TransactionsPercDiff)
)
- Mark as New
- Bookmark
- Subscribe
- Mute
- Subscribe to RSS Feed
- Permalink
- Report Inappropriate Content
It still doesn't show me the total row.
Can you give an example of how to do it right and what you are displaying in the variables?
I used 2 row dimensions (Store & Cost/Quantity/Cost per Unit), 1 column dimension (Actual/Budget/Diff), and 1 measure.
The measure formula include using Pick function inside another Pick function/
- Mark as New
- Bookmark
- Subscribe
- Mute
- Subscribe to RSS Feed
- Permalink
- Report Inappropriate Content
Hi, 'Cost/Quantity/Cost per Unit' is not shown in the initial image, that is Transactions/Items Sold/Sales Amount?
In that case, don't set it as dimension, use 3 different measures. I posted the Transactions measure as an example, it will need to add another 2 measures: for Items Sold and for Sales Amount.
So Store as horizontal dimension, Actual/Budget/Diff as vertical dimension, and 3 different measures, setting the Values as rows instead of columns.
- Mark as New
- Bookmark
- Subscribe
- Mute
- Subscribe to RSS Feed
- Permalink
- Report Inappropriate Content
Thanks a lot for the help - your solution worked great!
I posted a more difficult follow-up question, I'd appreciate it if you could take a look and help 🙂