Unlock a world of possibilities! Login now and discover the exclusive benefits awaiting you.
- Qlik Community
- :
- Forums
- :
- Analytics & AI
- :
- Products & Topics
- :
- Visualization and Usability
- :
- Revenue by month vs plan
- Subscribe to RSS Feed
- Mark Topic as New
- Mark Topic as Read
- Float this Topic for Current User
- Bookmark
- Subscribe
- Mute
- Printer Friendly Page
- Mark as New
- Bookmark
- Subscribe
- Mute
- Subscribe to RSS Feed
- Permalink
- Report Inappropriate Content
Revenue by month vs plan
hi Guys,
i am pretty new to qlik but like the software so far. I was able to create some apps already, but struggeling with something I already did in Excel but fail to convert into Qlik. Maybe someone can help 
What I want, is to display revenue by moth and compare that to plan / target.
In the end it is supposed to look like this:
(dont mind the different colours, it would be okay for now if it would only compare sales vs plan).
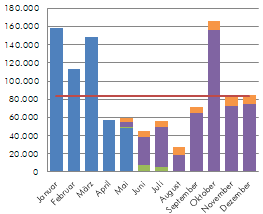
I am sure I need to use the Combo Diagram, but I fail to sturckture my Data right I guess.
I tried to abstract how I have the data available at this point and attached it into the excel sheet below.
It would be possible for me to restructure the data, if it would help getting to where I want
Tabelle1 = revenue
Tabelle2 = plan
Thank you already for your help, much appreciated.