Unlock a world of possibilities! Login now and discover the exclusive benefits awaiting you.

- Qlik Community
- :
- Forums
- :
- Analytics & AI
- :
- Products & Topics
- :
- Visualization and Usability
- :
- % Symbal
- Subscribe to RSS Feed
- Mark Topic as New
- Mark Topic as Read
- Float this Topic for Current User
- Bookmark
- Subscribe
- Mute
- Printer Friendly Page

- Mark as New
- Bookmark
- Subscribe
- Mute
- Subscribe to RSS Feed
- Permalink
- Report Inappropriate Content
% Symbal
Hi
I have line chart Year and Values.Now i want to display this values with % symbal.
How can i add % symbal with values.
Thanks
Govind R
Accepted Solutions

 prahladind9
- Mark as New
- Bookmark
- Subscribe
- Mute
- Subscribe to RSS Feed
- Permalink
- Report Inappropriate Content
Hi,
I'm Using Qlik Sense.
Just go to data -> Number Formatting -->Custom---->> Format Pattern '##%'
That's it your data will appear with % ending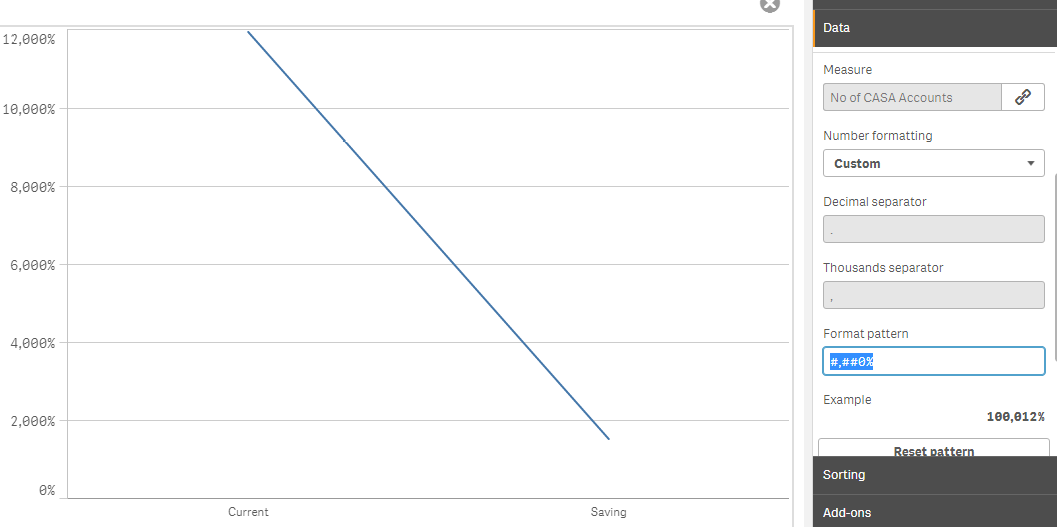
Hope this helps 🙂

 gautik92
- Mark as New
- Bookmark
- Subscribe
- Mute
- Subscribe to RSS Feed
- Permalink
- Report Inappropriate Content
click on the expression and check on the Relative option in Expression tab

 arulsettu
- Mark as New
- Bookmark
- Subscribe
- Mute
- Subscribe to RSS Feed
- Permalink
- Report Inappropriate Content
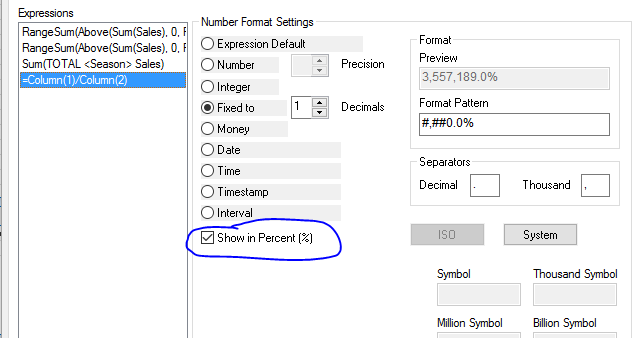
properties->number->integer then enable show in percentage

 sunny_talwar
- Mark as New
- Bookmark
- Subscribe
- Mute
- Subscribe to RSS Feed
- Permalink
- Report Inappropriate Content
Change the settings on the number tab to check 'Show in Percent (%)'
 Chanty4u
- Mark as New
- Bookmark
- Subscribe
- Mute
- Subscribe to RSS Feed
- Permalink
- Report Inappropriate Content
try to your measure
=num(sum(Sales)/sum(total Sales),'%')
or
=num(sum(Sales)/sum(total Sales),'0%')
- Mark as New
- Bookmark
- Subscribe
- Mute
- Subscribe to RSS Feed
- Permalink
- Report Inappropriate Content
Dear Friends,
I am using qlik sense. Not Qlik View.
My chart having 2 values
Year and total growth
Total formulae:
((sum(Expense_GL)-RangeSum(Above(sum(Expense_GL))))/RangeSum(Above(sum(Expense_GL))))\
Now i want to display with % .
prahladind9
- Mark as New
- Bookmark
- Subscribe
- Mute
- Subscribe to RSS Feed
- Permalink
- Report Inappropriate Content
Hi,
I'm Using Qlik Sense.
Just go to data -> Number Formatting -->Custom---->> Format Pattern '##%'
That's it your data will appear with % ending
Hope this helps 🙂
- Mark as New
- Bookmark
- Subscribe
- Mute
- Subscribe to RSS Feed
- Permalink
- Report Inappropriate Content
Change number formatting for this measure: instead of Auto use Number.
Then use Custom Formatting. Put a "%" sign in the end of Format pattern like: