Unlock a world of possibilities! Login now and discover the exclusive benefits awaiting you.

- Qlik Community
- :
- Discover
- :
- Qlik Community
- :
- Water Cooler
- :
- relative position and values between two graphs
- Subscribe to RSS Feed
- Mark Topic as New
- Mark Topic as Read
- Float this Topic for Current User
- Bookmark
- Subscribe
- Mute
- Printer Friendly Page

- Mark as New
- Bookmark
- Subscribe
- Mute
- Subscribe to RSS Feed
- Permalink
- Report Inappropriate Content
relative position and values between two graphs
Hi all.
I'd want to obtain this kind of graph
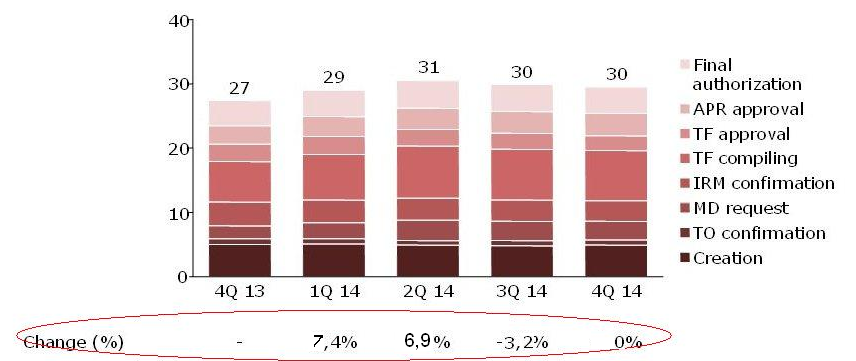
the chart is easy to get. The problem is the line "Change(%)".
In this section, I want the % between a quarter and the previous quarter (7,4 is 29-27=2 and 2 is 7.4% of 27). The first value is always " - ", the others are according to the results of the graph.
Again, I'd want the numbers remain aligned to the quarter (1Q13, 1Q14 ...) of the X axis of the graph.
how can I do?
Many thanks in advance.
Luca
- Tags:
- %
- positioning
- relative
- « Previous Replies
-
- 1
- 2
- Next Replies »
Accepted Solutions

 Clever_Anjos
- Mark as New
- Bookmark
- Subscribe
- Mute
- Subscribe to RSS Feed
- Permalink
- Report Inappropriate Content
A better solution...
Clever_Anjos
- Mark as New
- Bookmark
- Subscribe
- Mute
- Subscribe to RSS Feed
- Permalink
- Report Inappropriate Content
Put a straight table just below of your bar graph.
Mark it as "Horizontal" and use same dimension of your graph bar

 Gysbert_Wassena
- Mark as New
- Bookmark
- Subscribe
- Mute
- Subscribe to RSS Feed
- Permalink
- Report Inappropriate Content
Well, not quite what you're asking for, but pretty close I think. See attached qvw.
talk is cheap, supply exceeds demand
Clever_Anjos
- Mark as New
- Bookmark
- Subscribe
- Mute
- Subscribe to RSS Feed
- Permalink
- Report Inappropriate Content
PFA
- Mark as New
- Bookmark
- Subscribe
- Mute
- Subscribe to RSS Feed
- Permalink
- Report Inappropriate Content
thanks, Clever.
% count is ok, but alignment is lost when data changes.How can I dynamically tune the size of the table with those of the graph?
luca
Clever_Anjos
- Mark as New
- Bookmark
- Subscribe
- Mute
- Subscribe to RSS Feed
- Permalink
- Report Inappropriate Content
You mean when showing less values?
- Mark as New
- Bookmark
- Subscribe
- Mute
- Subscribe to RSS Feed
- Permalink
- Report Inappropriate Content
Yes, exactly.
if the values are more (or less), the alignment is lost.
many thanks
luca
Clever_Anjos
- Mark as New
- Bookmark
- Subscribe
- Mute
- Subscribe to RSS Feed
- Permalink
- Report Inappropriate Content
I don´t see how I could do that
- Mark as New
- Bookmark
- Subscribe
- Mute
- Subscribe to RSS Feed
- Permalink
- Report Inappropriate Content
is it possible get the position of the legend of the x axis (1Q13, 1Q14 ..) and on this build the table?
Clever_Anjos
- Mark as New
- Bookmark
- Subscribe
- Mute
- Subscribe to RSS Feed
- Permalink
- Report Inappropriate Content
I´m almost sure not, you can´t get it
- « Previous Replies
-
- 1
- 2
- Next Replies »