Unlock a world of possibilities! Login now and discover the exclusive benefits awaiting you.

- Qlik Community
- :
- Discover
- :
- Qlik Community
- :
- Water Cooler
- :
- Re: set analysis Possible combination counts
Options
- Subscribe to RSS Feed
- Mark Topic as New
- Mark Topic as Read
- Float this Topic for Current User
- Bookmark
- Subscribe
- Mute
- Printer Friendly Page
Turn on suggestions
Auto-suggest helps you quickly narrow down your search results by suggesting possible matches as you type.
Showing results for

 shruthibk
Creator
2018-12-17
03:10 AM
- Mark as New
- Bookmark
- Subscribe
- Mute
- Subscribe to RSS Feed
- Permalink
- Report Inappropriate Content
set analysis Possible combination counts
Hi All,
I have sample data as below
ID,Location,market,submitdate
01,CA,America,'2018-10-01',
01,TX,America,'2018-10-01',
02,CA,America,'2018-10-01'
01,PA,America,'2018-09-01',
02,TX,America,'2018-09-01',
01,TX,America,'2018-09-01'
01,CA,America,'2018-08-01'
expected output
submitdate,count of product id
2018-10-01, 5
2018-09-01, 4
2018-08-01, 1
Logic is for check the possible (ID &Location) with previous months
I am able to achieve this in text object but I am not getting how to achieve in the chart with dimension as date .
Thanks,
Shruthi B K
2,308 Views
- « Previous Replies
-
- 1
- 2
- Next Replies »
11 Replies
shruthibk
Creator
2018-12-21
02:04 AM
Author
- Mark as New
- Bookmark
- Subscribe
- Mute
- Subscribe to RSS Feed
- Permalink
- Report Inappropriate Content
ya it will be 5 for 01-10-2018, 4 for 01-09-2018 and 1 for 01-08-2018
607 Views

 sunny_talwar
MVP
2018-12-21
07:45 AM
- Mark as New
- Bookmark
- Subscribe
- Mute
- Subscribe to RSS Feed
- Permalink
- Report Inappropriate Content
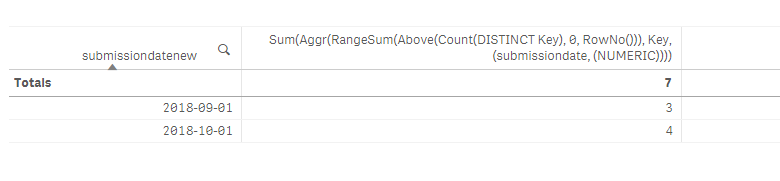
Try this
Sum(Aggr(RangeSum(Above(Count(DISTINCT Key), 0, RowNo())), Key, (submissiondate, (NUMERIC))))

- « Previous Replies
-
- 1
- 2
- Next Replies »