Unlock a world of possibilities! Login now and discover the exclusive benefits awaiting you.
- Qlik Community
- :
- All Forums
- :
- QlikView
- :
- How to display missing ranges in bin
- Subscribe to RSS Feed
- Mark Topic as New
- Mark Topic as Read
- Float this Topic for Current User
- Bookmark
- Subscribe
- Mute
- Printer Friendly Page
- Mark as New
- Bookmark
- Subscribe
- Mute
- Subscribe to RSS Feed
- Permalink
- Report Inappropriate Content
How to display missing ranges in bin
Hello,
Any idea's how I can force QV to also show ranges in a bin for which there are no data to display?
LOAD * INLINE [
ID, RefDuty
1, 11
2, 19
3, 31
4, 32
5, 41
];
Straight table:
Used Dimensions > Add calculated Dimension --> class(RefDuty, 10)
Expressions > Definition --> NumericCount (RefDuty)
Output:
class(RefDuty, 10) NumericCount (RefDuty)
10 <= x < 20 2
30 <= x < 40 2
40 <= x < 50 1
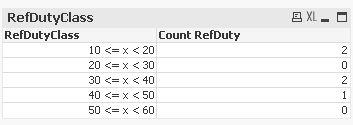
Expected behavior:
10 <= x < 20 2
20 <= x < 30 0
30 <= x < 40 2
40 <= x < 50 1
Thanks
Peter
- Tags:
- new_to_qlikview
Accepted Solutions
- Mark as New
- Bookmark
- Subscribe
- Mute
- Subscribe to RSS Feed
- Permalink
- Report Inappropriate Content
- Mark as New
- Bookmark
- Subscribe
- Mute
- Subscribe to RSS Feed
- Permalink
- Report Inappropriate Content
Load
*,
IF(RefDuty >= 10 and RefDuty < 20, '10 <= x < 20',
IF(RefDuty >= 20 and RefDuty < 30, '20 <= x < 30',
IF(RefDuty >= 30 and RefDuty < 40, '30 <= x < 40',
IF(RefDuty >= 40 and RefDuty < 50, '40 <= x < 50')))) as Class
Inline
[
ID, RefDuty
1, 11
2, 19
3, 31
4, 32
5, 41
];
Load * Inline
[
Range, Class
10 <= x < 20,10 <= x < 20
20 <= x < 30,20 <= x < 30
30 <= x < 40,30 <= x < 40
40 <= x < 50,40 <= x < 50
];
Now create a straight table...
Dimension
Class
Expression
NumericCount (RefDuty)
Go to Presentation tab and untick Suppress Zero Values
- Mark as New
- Bookmark
- Subscribe
- Mute
- Subscribe to RSS Feed
- Permalink
- Report Inappropriate Content
Hi,
another solution:
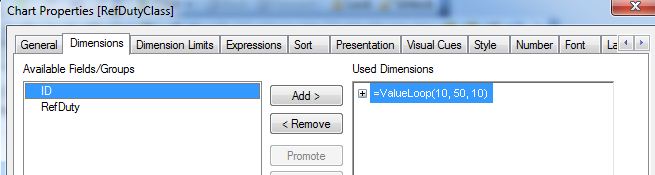
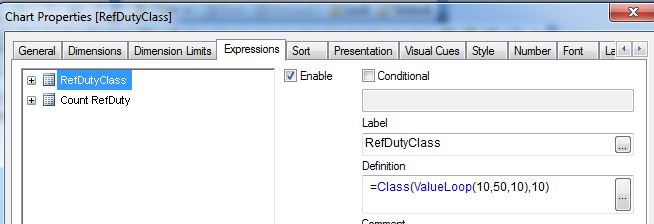
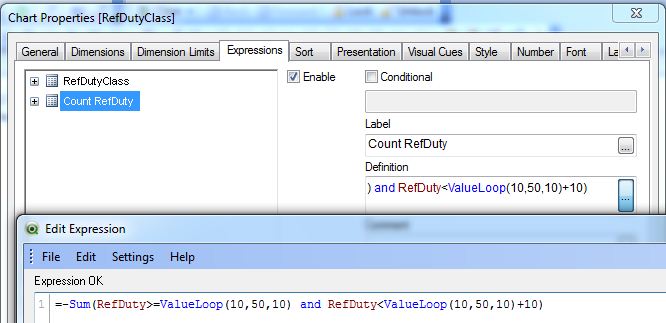
hope this helps
regards
Marco