Unlock a world of possibilities! Login now and discover the exclusive benefits awaiting you.
- Qlik Community
- :
- All Forums
- :
- QlikView
- :
- Urgent Help Required
- Subscribe to RSS Feed
- Mark Topic as New
- Mark Topic as Read
- Float this Topic for Current User
- Bookmark
- Subscribe
- Mute
- Printer Friendly Page
- Mark as New
- Bookmark
- Subscribe
- Mute
- Subscribe to RSS Feed
- Permalink
- Report Inappropriate Content
Urgent Help Required
Hi All,
I need to show the bar chart of the sum of Projection amount month wise on below criteria
If the year is 2013 then use the projection 'OP' to count the Amount
If the year is >=2014 then use the projection 'B Q4' if not exits then use B Q3, if not then B Q2, if not then B Q1 to count the Amount
Attaching the data sheet. Please let me know if questions.
Thanks for all help.
Regards,
Ankit
- Tags:
- new_to_qlikview
- Mark as New
- Bookmark
- Subscribe
- Mute
- Subscribe to RSS Feed
- Permalink
- Report Inappropriate Content
can anyone please answer
- Mark as New
- Bookmark
- Subscribe
- Mute
- Subscribe to RSS Feed
- Permalink
- Report Inappropriate Content
Hi, You will have to concatenate this excel to your fact tables to start to play with the project amount.
see this
hope help
Fernando
- Mark as New
- Bookmark
- Subscribe
- Mute
- Subscribe to RSS Feed
- Permalink
- Report Inappropriate Content
I don't have any fact tables, assume only have this excel to load and populate the numbers.
- Mark as New
- Bookmark
- Subscribe
- Mute
- Subscribe to RSS Feed
- Permalink
- Report Inappropriate Content
you dont have any data before this excel? this is the project or the objetive of what?
- Mark as New
- Bookmark
- Subscribe
- Mute
- Subscribe to RSS Feed
- Permalink
- Report Inappropriate Content
Here is a quick expression that you can use in the UI.
if( Year=2013,
sum( {$<Projections={OP}>} Amount),
if ( Year >= 2014,
if( sum( {$<Projections={'B Q4'}>} Amount) > 0, sum( {$<Projections={'B Q4'}>} Amount),
if( sum( {$<Projections={'B Q3'}>} Amount) > 0, sum( {$<Projections={'B Q3'}>} Amount),
if( sum( {$<Projections={'B Q2'}>} Amount) > 0, sum( {$<Projections={'B Q2'}>} Amount),
sum( {$<Projections={'B Q1'}>} Amount)
)
)
)
)
)
results (on the right):
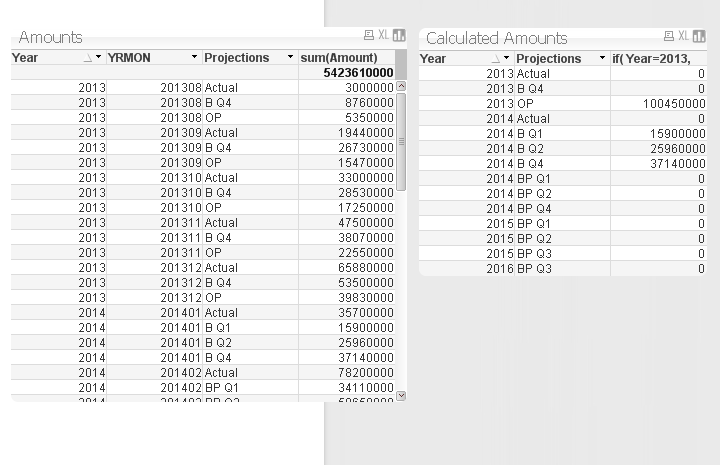
I added "year" as a field in the load script:
LOAD
left( YRMON, 4) * 1 as Year,
YRMON,
Projections,
Amount
FROM
(biff, embedded labels, table is Sheet1$);
- Mark as New
- Bookmark
- Subscribe
- Mute
- Subscribe to RSS Feed
- Permalink
- Report Inappropriate Content
Its objective to just display the projections in a tab. not link to any thing else in the tab.
- Mark as New
- Bookmark
- Subscribe
- Mute
- Subscribe to RSS Feed
- Permalink
- Report Inappropriate Content
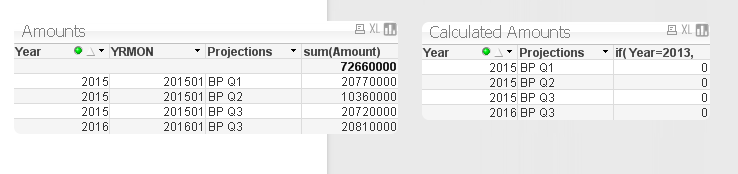
In your QlikView, we dont have data for 2105,2016. Also we need to show the data on month and month so we wont show data for actual and other stuff.
- Mark as New
- Bookmark
- Subscribe
- Mute
- Subscribe to RSS Feed
- Permalink
- Report Inappropriate Content
Your description was as follows with nothing specified for BP Q1 , BP Q2, BP Q3, BP Q4 which is where the 2015,2016 data falls per below.
"if the year is 2013 then use the projection 'OP' to count the Amount
If the year is >=2014 then use the projection 'B Q4' if not exits then use B Q3, if not then B Q2, if not then B Q1 to count the Amount"
If your description is not complete or inaccurate please let me know.