Unlock a world of possibilities! Login now and discover the exclusive benefits awaiting you.
- Qlik Community
- :
- All Forums
- :
- QlikView
- :
- Adding reference line - Line Chart
- Subscribe to RSS Feed
- Mark Topic as New
- Mark Topic as Read
- Float this Topic for Current User
- Bookmark
- Subscribe
- Mute
- Printer Friendly Page
- Mark as New
- Bookmark
- Subscribe
- Mute
- Subscribe to RSS Feed
- Permalink
- Report Inappropriate Content
Adding reference line - Line Chart
What are the steps of adding vertical reference lines in a line chart? Please help..!!
- Tags:
- new_to_qlikview
Accepted Solutions
- Mark as New
- Bookmark
- Subscribe
- Mute
- Subscribe to RSS Feed
- Permalink
- Report Inappropriate Content
Hi,
maybe using a combo chart instead of a line chart and creating a narrow bar at a specific date using some flag.
hope this helps
regards
Marco
- Mark as New
- Bookmark
- Subscribe
- Mute
- Subscribe to RSS Feed
- Permalink
- Report Inappropriate Content
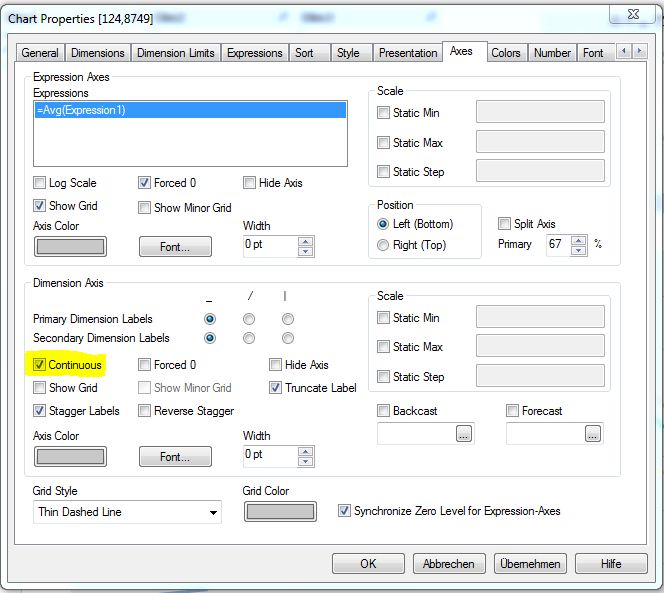
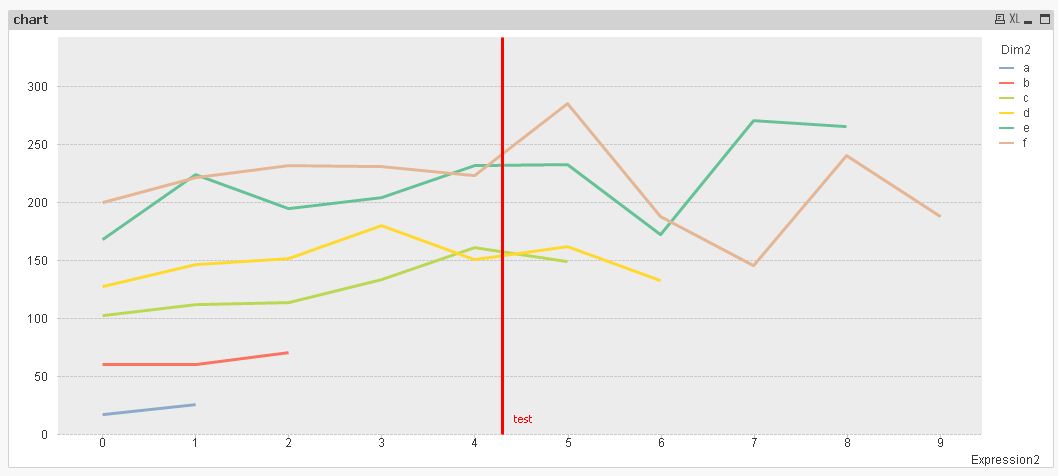
As far as I know, you can only use the inbuilt reference line function when your x axis is continuous.
Go to Axes and on the bottom half of the options, tick continuous for your axis (assuming you want it to be..!)
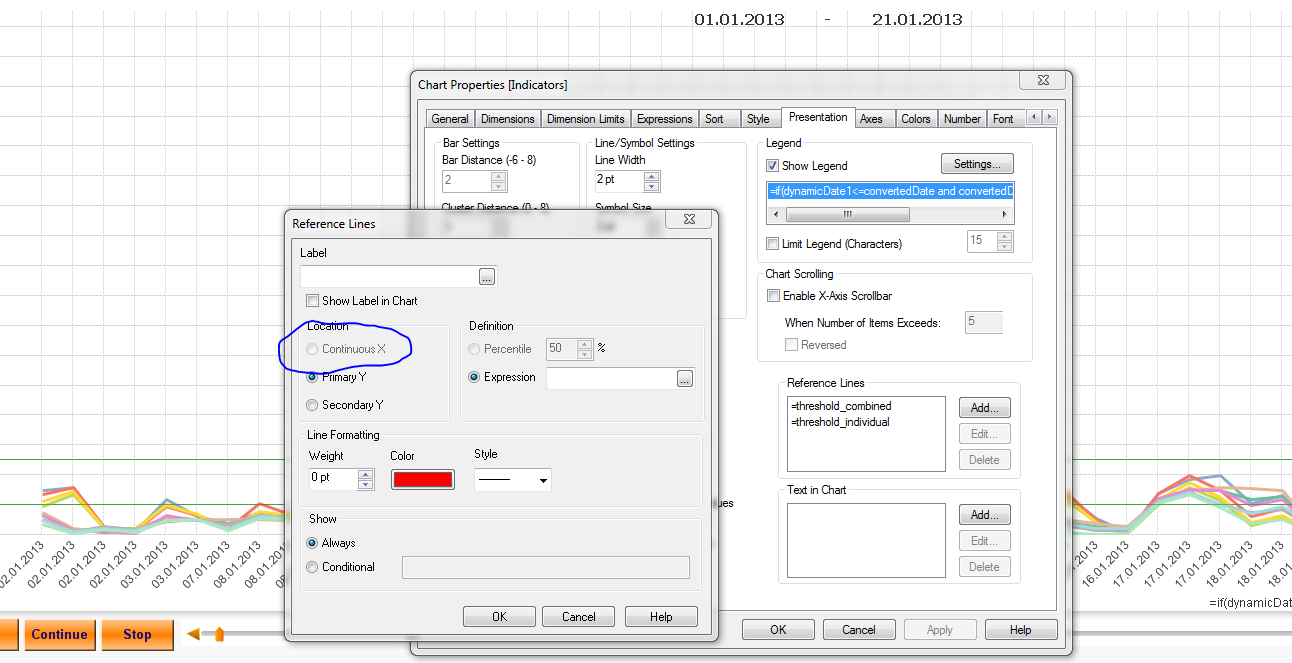
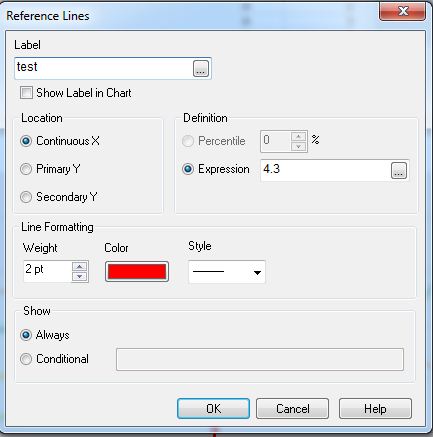
Then in the Presentation tab you can choose reference line, add one on the Continuous X Axis and give it an expression like =5 for example, which on a continuous scale from 1-20 would create a reference line at 5.
- Mark as New
- Bookmark
- Subscribe
- Mute
- Subscribe to RSS Feed
- Permalink
- Report Inappropriate Content
Hello,
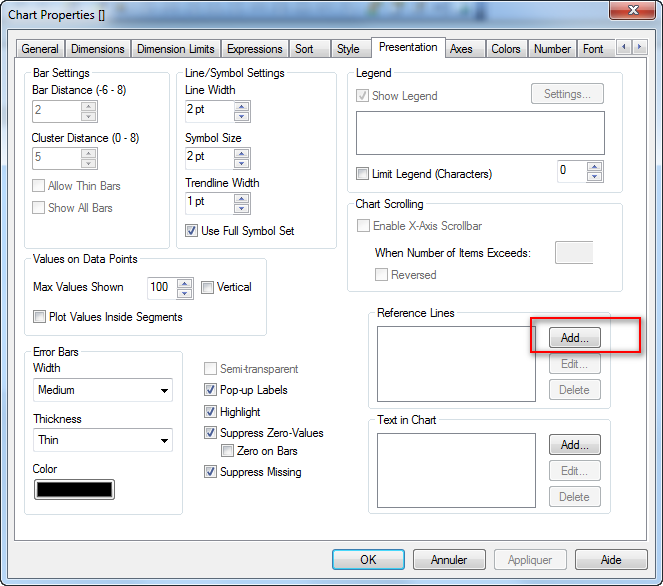
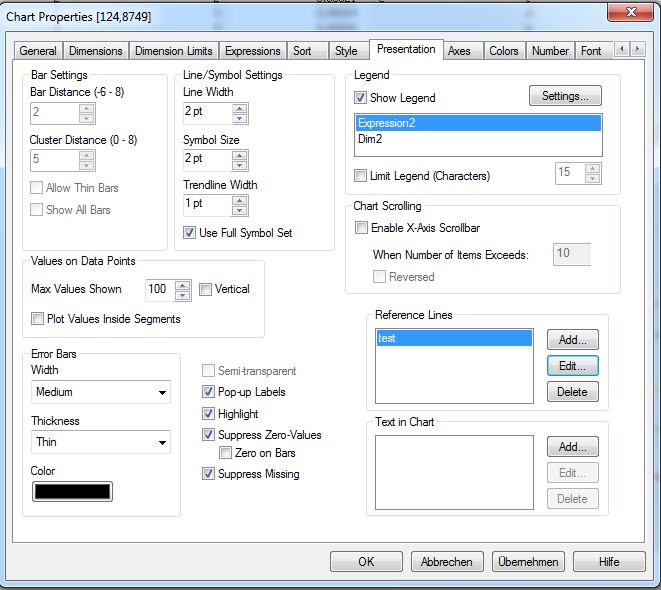
In presentation tab, click on add a reference line.
You can put an expression or a value.
- Mark as New
- Bookmark
- Subscribe
- Mute
- Subscribe to RSS Feed
- Permalink
- Report Inappropriate Content
Thanks for the reply. I'm getting continuous x option as disabled. Can you tell me the reason possibly behind it?
- Mark as New
- Bookmark
- Subscribe
- Mute
- Subscribe to RSS Feed
- Permalink
- Report Inappropriate Content
Thanks for the reply. I'm getting continuous x option as disabled. Can you tell me the reason possibly behind it?

- Mark as New
- Bookmark
- Subscribe
- Mute
- Subscribe to RSS Feed
- Permalink
- Report Inappropriate Content
Hi,
vertical reference lines are only available for continuous dimension axes, so you have to set your dimension axis properties accordingly:
hope this helps
regards
Marco
- Mark as New
- Bookmark
- Subscribe
- Mute
- Subscribe to RSS Feed
- Permalink
- Report Inappropriate Content
Thank you so much for the help. But I can't make my dimension axis continuous as I'm representing dates as my dimension which are take from an excel sheet and are not continuous.
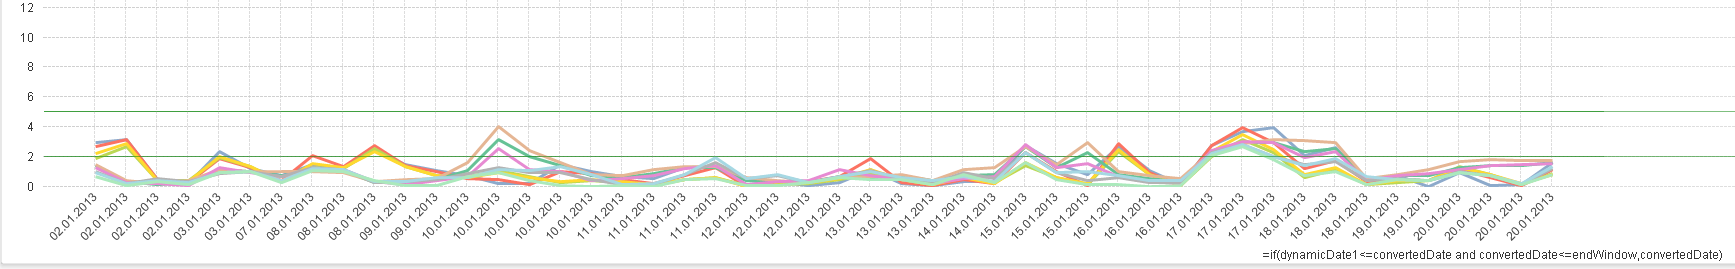
Is it still possible to define some vertical reference lines at some of the selected dates?
Thanks and Regards
Nishant
- Mark as New
- Bookmark
- Subscribe
- Mute
- Subscribe to RSS Feed
- Permalink
- Report Inappropriate Content
Hi,
maybe using a combo chart instead of a line chart and creating a narrow bar at a specific date using some flag.
hope this helps
regards
Marco
- Mark as New
- Bookmark
- Subscribe
- Mute
- Subscribe to RSS Feed
- Permalink
- Report Inappropriate Content
I need same in Qliksense, Do we have any work around to check? If possible, Can you share V1 in sense (QVF).