Unlock a world of possibilities! Login now and discover the exclusive benefits awaiting you.
- Qlik Community
- :
- All Forums
- :
- QlikView App Dev
- :
- Chart last 6 months average
- Subscribe to RSS Feed
- Mark Topic as New
- Mark Topic as Read
- Float this Topic for Current User
- Bookmark
- Subscribe
- Mute
- Printer Friendly Page
- Mark as New
- Bookmark
- Subscribe
- Mute
- Subscribe to RSS Feed
- Permalink
- Report Inappropriate Content
Chart last 6 months average
Hi guys, I need your help,
I have this chart below, with some values in bars and lines, but these lines are not right.
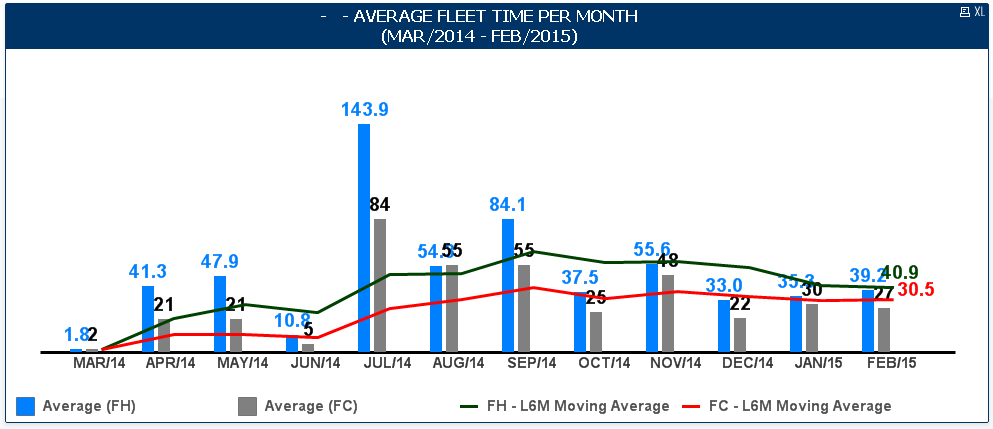
The lines should shows the average of last 6 months in each month.
In other words, the values of the each month in the lines must be the average of the last 6 values on the bars, for example the line value in FEB/15 should be 47,4 that is from average of (39.2, 35.3, 33.0, 55.6, 37.5, 84.1) (blue bars) and the line value of JAN/15 should be 50 from (35.3, 33.0, 55.6, 37.5, 84.1, 54.3)
I need create an expression in this chart to do that, below its a table with the correct values that should be in the chart.
Date | Average (FH) | Average (FC) | FH - L6M Moving Average | FC - L6M Moving Average |
| MAR/14 | 1,8 | 2 | 1,8 | 2 |
| APR/14 | 41,3 | 21 | 21,6 | 12 |
| MAY/14 | 47,9 | 21 | 30,4 | 15 |
| JUN/14 | 10,8 | 5 | 25,5 | 12 |
| JUL/14 | 143,9 | 84 | 49,2 | 27 |
| AUG/14 | 54,3 | 55 | 50,0 | 31 |
| SEP/14 | 84,1 | 55 | 63,7 | 40 |
| OCT/14 | 37,5 | 25 | 63,1 | 41 |
| NOV/14 | 55,6 | 48 | 64,4 | 45 |
| DEC/14 | 33,0 | 22 | 68,1 | 48 |
| JAN/15 | 35,3 | 30 | 50,0 | 39 |
| FEB/15 | 39,2 | 27 | 47,4 | 34 |
Thanks guys.
- Tags:
- new_to_qlikview
Accepted Solutions
- Mark as New
- Bookmark
- Subscribe
- Mute
- Subscribe to RSS Feed
- Permalink
- Report Inappropriate Content
Hi Giovani,
Please use the below expression to get the desired value.
Last 6 month moving average for FH
=rangeavg(Above(sum(FH),0,6))
Last 6 month moving average for FC
=rangeavg(Above(sum(FC),0,6))
Thanks,
Sajeevan
- Mark as New
- Bookmark
- Subscribe
- Mute
- Subscribe to RSS Feed
- Permalink
- Report Inappropriate Content
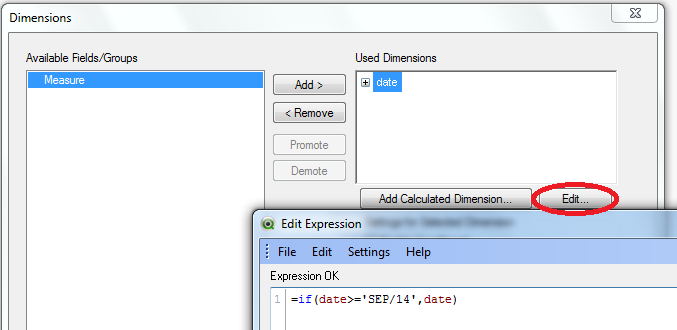
Hi,
You can try below expression in dimentions.
=if(Date>='SEP/14',Date)
- Mark as New
- Bookmark
- Subscribe
- Mute
- Subscribe to RSS Feed
- Permalink
- Report Inappropriate Content
Doesnt work, 😕
Its a moving average, the value in feb/15 must be the average of the bar values from sep/14 to feb/15
- Mark as New
- Bookmark
- Subscribe
- Mute
- Subscribe to RSS Feed
- Permalink
- Report Inappropriate Content
Hi Giovani,
Please use the below expression to get the desired value.
Last 6 month moving average for FH
=rangeavg(Above(sum(FH),0,6))
Last 6 month moving average for FC
=rangeavg(Above(sum(FC),0,6))
Thanks,
Sajeevan
- Mark as New
- Bookmark
- Subscribe
- Mute
- Subscribe to RSS Feed
- Permalink
- Report Inappropriate Content
Hi,
You can do like this image.
- Mark as New
- Bookmark
- Subscribe
- Mute
- Subscribe to RSS Feed
- Permalink
- Report Inappropriate Content
HI Giovani,
try for below steps:
this is for last 6 months
Avg({<Date={'>=$(=max(Date)-5)<=$(=max(Date))'}>}FH)
Avg({<Date={'>=$(=max(Date)-5)<=$(=max(Date))'}>}FC)
- Mark as New
- Bookmark
- Subscribe
- Mute
- Subscribe to RSS Feed
- Permalink
- Report Inappropriate Content
Hi Sajeevan,
I just changed to avg instead of sum and work beautifully. =rangeavg(Above(avg(FC),0,6))
Thank you so much Sajeevan, you rule dude!