Unlock a world of possibilities! Login now and discover the exclusive benefits awaiting you.
- Qlik Community
- :
- All Forums
- :
- QlikView
- :
- QlikView Quarter Filter
- Subscribe to RSS Feed
- Mark Topic as New
- Mark Topic as Read
- Float this Topic for Current User
- Bookmark
- Subscribe
- Mute
- Printer Friendly Page
- Mark as New
- Bookmark
- Subscribe
- Mute
- Subscribe to RSS Feed
- Permalink
- Report Inappropriate Content
QlikView Quarter Filter
Hello Everyone,
I need some help regarding a quarter selection in my qvw file.
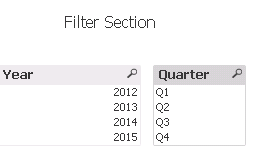
In my file, there are two filters (Year and Quarter) available.
Please have a look at the below two screenshots.
The Requirement is, if I select Year (e.g 2015) and Quarter(Q1), then my chart should show latest 8 quarters. But currently the chart is showing all the 12 quarters which are as follows:
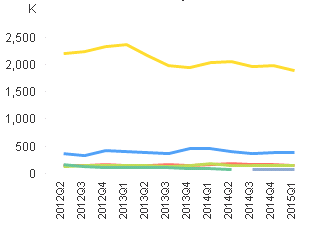
But the Chart Dimension is not a Date Column (e.g 2015Q1, 2014Q4).
What should be the expression? currently this expression is used: sum(Proj__Default_Crp).
Looking forward to the correct answer.
Regards,
Sajid.
Accepted Solutions
- Mark as New
- Bookmark
- Subscribe
- Mute
- Subscribe to RSS Feed
- Permalink
- Report Inappropriate Content
Hi,
You need to bring date field from Year and Quarter in script, after that it would be easier to handle this
Data:
LOAD
*,
MakeDate(Year, Right(Quarter, 1) * 3) AS Date
FROM DataSource;
Now in set analysis use this expressions
=sum({<Year=, Quarter=, Date={'>=$(=QuarterStart(Max(Date), -7))<=$(=QuarterEnd(Max(Date)))'}>}Proj__Default_Crp)
Hope this helps you.
Regards,
Jagan