Unlock a world of possibilities! Login now and discover the exclusive benefits awaiting you.
- Qlik Community
- :
- Forums
- :
- Analytics
- :
- New to Qlik Analytics
- :
- Set analysis
- Subscribe to RSS Feed
- Mark Topic as New
- Mark Topic as Read
- Float this Topic for Current User
- Bookmark
- Subscribe
- Mute
- Printer Friendly Page
- Mark as New
- Bookmark
- Subscribe
- Mute
- Subscribe to RSS Feed
- Permalink
- Report Inappropriate Content
Set analysis
Hi all,
In the pie chart I need to exclude the data of batch_meta_data_id = {1,4,5} and I want to select the data of only, final_test_status = {'passed'} ,version={'v1'}.
Is the below expression is correct? If not please help with the correct one.
SUM({$-1<batch_meta_data_id = {1, 4, 5},final_test_status = {'passed'},version={'v1'}>}browser_visits)
Thanks,
Pramod
- Tags:
- set analysis
- « Previous Replies
-
- 1
- 2
- Next Replies »
- Mark as New
- Bookmark
- Subscribe
- Mute
- Subscribe to RSS Feed
- Permalink
- Report Inappropriate Content
Try this:
=Sum({$<batch_meta_data_id -= {1, 4, 5}, final_test_status = {'passed'}, version={'v1'}>}browser_visits)
Update: Explanation
Exclude batch_meta_data_id 1, 4, 5 -> batch_meta_data_id -= {1, 4, 5} //with a negative before equal sign
Only passed final_test_status and v1 version -> final_test_status = {'passed'}, version={'v1'}
HTH
Best,
Sunny
- Mark as New
- Bookmark
- Subscribe
- Mute
- Subscribe to RSS Feed
- Permalink
- Report Inappropriate Content
No values are changing. it remains same.
$ will select the data right, but i want to exclude the {1,4,5} and select other batches data.
- Mark as New
- Bookmark
- Subscribe
- Mute
- Subscribe to RSS Feed
- Permalink
- Report Inappropriate Content
Hi,
$-1 is used to get previous selection data
Use this
SUM({$<batch_meta_data_id -= {1, 4, 5},final_test_status = {'passed'},version={'v1'}>}browser_visits)
- Mark as New
- Bookmark
- Subscribe
- Mute
- Subscribe to RSS Feed
- Permalink
- Report Inappropriate Content
Hey Pramod
I am not sure I understand what you mean??? The expression I gave you will work the following way:
With no selections made it will show all batch_meta_data_id except 1,4 and 5 and final_test_status passed and version v1. If you make a selection in final_test_status or version, it won't have impact on your expression's output, but batch_meta_data_id selection will reduce your output to those ids which are selected (still excluding 1, 4 and 5) and any other selection will also filter the expression (because of $). If you don't want your expression to impacted with any selection then you can use 1 instead of $ (although it will still filter down on selection in batch_meta_data_id)
I hope this helps.
Best,
Sunny
- Mark as New
- Bookmark
- Subscribe
- Mute
- Subscribe to RSS Feed
- Permalink
- Report Inappropriate Content
Hi sunny,
I am attaching the .qvf file.
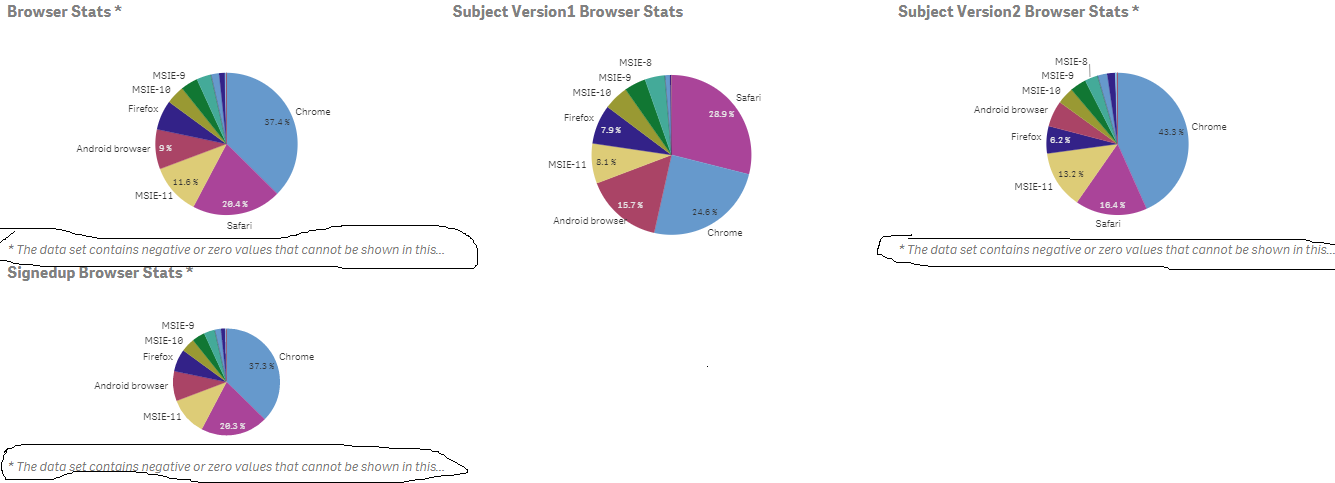
In Os and browser sheet, i am using the 2 pie charts to display the browser stats of the batches.
I am using 3 KPI's.
KPI 1 has 16,287.
KPI 2 has 1,040
KPI 3 has 16,247
I need to display the browser stats for the version 1 and 2 in two different pie charts.
I am having counts problem.
KPI 3 + KPI 2 =KPI 1
I am not getting where i am going wrong.
Please check it and help.
Regards,
Pramod
- Mark as New
- Bookmark
- Subscribe
- Mute
- Subscribe to RSS Feed
- Permalink
- Report Inappropriate Content
V1 and V2 overlaps each other, take a look on attachment hope it will be useful.
- Mark as New
- Bookmark
- Subscribe
- Mute
- Subscribe to RSS Feed
- Permalink
- Report Inappropriate Content
try this
SUM({<batch_meta_data_id -= {'1', '4', '5'},final_test_status = {'passed'},version={'v1'}>}browser_visits)
and let me know
- Mark as New
- Bookmark
- Subscribe
- Mute
- Subscribe to RSS Feed
- Permalink
- Report Inappropriate Content
Hi Saravana,
Thanks for the help.
The counts are now matching.
Why the line " the data contains negative or zero values that cannot be shown on this." is displaying.
How can i hide this line.
Regards,
Pramod
- Mark as New
- Bookmark
- Subscribe
- Mute
- Subscribe to RSS Feed
- Permalink
- Report Inappropriate Content
A pie chart cannot meaningfully display data that contains a mix of positive and negative numbers. You can suppress the negative numbers or take absolute values, but that may distort the data in a way that will be hard for users interpret. A better visualisation for such data is a bar chart.
To suppress negatives:
Sum(RangeMax(Sales, 0))
To absolute values (most definitely NOT recommended)
Sum(Fabs(Sales)) or Fabs(Sum(Sales))
- « Previous Replies
-
- 1
- 2
- Next Replies »