Unlock a world of possibilities! Login now and discover the exclusive benefits awaiting you.
- Qlik Community
- :
- All Forums
- :
- QlikView
- :
- Show Bottom 5 in Bar Chart??
- Subscribe to RSS Feed
- Mark Topic as New
- Mark Topic as Read
- Float this Topic for Current User
- Bookmark
- Subscribe
- Mute
- Printer Friendly Page
- Mark as New
- Bookmark
- Subscribe
- Mute
- Subscribe to RSS Feed
- Permalink
- Report Inappropriate Content
Show Bottom 5 in Bar Chart??
Hi Friends,
I want to show bottom 5 values in Bar chart .This is sample data and logic.
| F1 | F2 |
| 100 | f |
| 90 | a |
| 85 | o |
| 80 | e |
| 75 | j |
| 70 | g |
| 65 | c |
| 60 | b |
| 55 | i |
| 50 | h |
| 45 | l |
| 40 | d |
| 35 | m |
| 30 | k |
| 15 | n |
I need to show bottom 5 values based on the condition that first I should arrange the data in descending order and after that I need to check 75% of the sum(F1). in this case it is 671. So I will consider only those (First) valuse whose sum is 671. Exclude all other values. So my result set will be
| 100 | f |
| 90 | a |
| 85 | o |
| 80 | e |
| 75 | j |
| 70 | g |
| 65 | c |
| 60 | b |
| 55 | i |
I need to show bottom 5 rom this result set in the Bar chart
| 75 | j |
| 70 | g |
| 65 | c |
| 60 | b |
| 55 | i |
Thanks in advance.
- Mark as New
- Bookmark
- Subscribe
- Mute
- Subscribe to RSS Feed
- Permalink
- Report Inappropriate Content
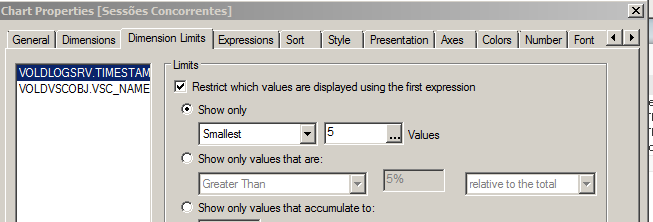
Use Dimension Limits Tab
- Mark as New
- Bookmark
- Subscribe
- Mute
- Subscribe to RSS Feed
- Permalink
- Report Inappropriate Content
Hi divya,
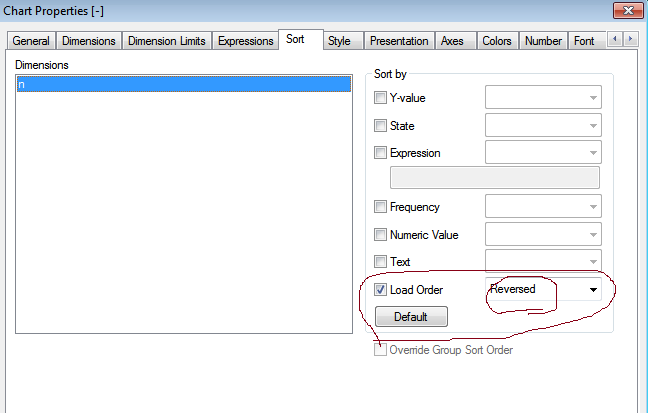
first sort the loading order in reverse like
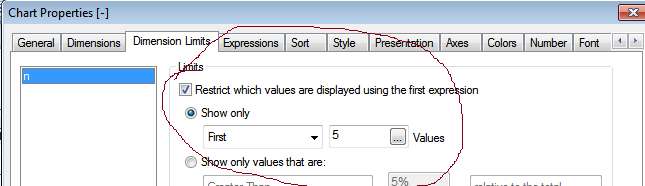
and next use the
- Mark as New
- Bookmark
- Subscribe
- Mute
- Subscribe to RSS Feed
- Permalink
- Report Inappropriate Content
Hi,
When I show smallest 5 it shows
| 45 | l |
| 40 | d |
| 35 | m |
| 30 | k |
| 15 | n |
But I need to show
| 75 | j |
| 70 | g |
| 65 | c |
| 60 | b |
| 55 | i |
- Mark as New
- Bookmark
- Subscribe
- Mute
- Subscribe to RSS Feed
- Permalink
- Report Inappropriate Content
Try expression something like:
Aggr(If(Rank(-Sum({<F2={"=Sum(F1)>Fractile(total F1,0.25)"}>}F1))<=5, Sum({<F2={"=Sum(F1)>Fractile(total F1,0.25)"}>}F1)), F2)