Unlock a world of possibilities! Login now and discover the exclusive benefits awaiting you.
- Qlik Community
- :
- All Forums
- :
- QlikView
- :
- How to check whether certain record timestamps ove...
- Subscribe to RSS Feed
- Mark Topic as New
- Mark Topic as Read
- Float this Topic for Current User
- Bookmark
- Subscribe
- Mute
- Printer Friendly Page
- Mark as New
- Bookmark
- Subscribe
- Mute
- Subscribe to RSS Feed
- Permalink
- Report Inappropriate Content
How to check whether certain record timestamps overlap...
Hi,
I have been given a set of data that is being extracted from several vending machines.The data contains information on coin shortages. Basically, every time a vending machine is low on change, it logs error code A214. When the change is replenished, it logs code A215.
Vending machines are located in several locations and each location can have multiple vending machines.
I have been tasked to create an application that records occurrences when all vending machines on site (per location) are low on change. I want to be able to create a report output that shows something similar to the below:
===========================================================
Example Report
===========================================================
Location Start_Date End_Date
Site1 01/01/2016 14:06:01 01/01/2016 20:45:21
Site2 01/05/2016 11:16:01 01/05/2016 18:23:14
Site2 01/05/2016 20:23:11 02/05/2016 09:00:01
Note: - The report must check for the low change status with all machines at the same location
- There could be multiple change shortages throughout the same day, these must all be recorded separately.
===========================================================
Sample Data
===========================================================
I have modelled the data to a point where I am able to construct a table with a row of data for each occurrence where a single machine is short on change (and when its replenished again).See below for an example.
| Location | DeviceID | EventDec | StartDateTime | EndDateTime |
| Site1 | 215320 | A214 | 01/01/2016 00:04 | 01/01/2016 12:11 |
| Site1 | 215328 | A215 | 01/01/2016 15:04 | 01/01/2016 19:11 |
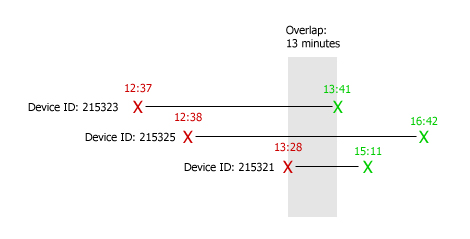
| Site 2 | 215323 | A214 | 01/01/2016 12:37 | 01/01/2016 13:41 |
| Site 2 | 215325 | A214 | 01/01/2016 12:38 | 01/01/2016 16:42 |
| Site 2 | 215321 | A214 | 01/01/2016 13:28 | 01/01/2016 15:11 |
| Site 3 | 215341 | A214 | 01/01/2016 13:28 | 01/01/2016 15:11 |
| Site 3 | 214321 | A214 | 01/01/2016 16:28 | 01/01/2016 17:11 |
| Site 3 | 211321 | A214 | 01/01/2016 18:28 | 01/01/2016 22:11 |
Note: The above data shows that Site 2 has had an overlap occurrence of 13 minutes between 13:28 (Device 215321 first shortage) and 13:41 (Device 215323 first replenishment). Device 215325 was also low on change between this time frame. See below for an illustration of this.
Thanks in advance.
Graham
===========================================================
EDIT:
===========================================================
I have also attached an example of the QVW file.
Accepted Solutions
- Mark as New
- Bookmark
- Subscribe
- Mute
- Subscribe to RSS Feed
- Permalink
- Report Inappropriate Content
I think it's due to the way the IntervalMatch matches into ranges (including limits) resp. how we derived the SubIntervals.
I've added a very small value to the SubIntervalStart just for the match, this seems to fix the issue.
- Mark as New
- Bookmark
- Subscribe
- Mute
- Subscribe to RSS Feed
- Permalink
- Report Inappropriate Content
You can try a brute force approach: create a cartesian product of the records with themselves so each record can be matched with the intervals of every other records. You can check with an if statement if there's any overlap.
Or you can use the IntervalMatch function.
You can find examples here: Re: Re: checking times with in a range of different time periods - need help plz..
talk is cheap, supply exceeds demand
- Mark as New
- Bookmark
- Subscribe
- Mute
- Subscribe to RSS Feed
- Permalink
- Report Inappropriate Content
Look into the tech doc
IntervalMatch and Slowly Changing Dimensions
page 17f concerning interval partioning:
Let vEpsilon = Pow(2,-27);
// Find all breakpoints of the intervals.

TempSubIntervals:
Load distinct SPID, Begin as SubFromDate Resident OriginalIntervals;
Load distinct SPID, End as SubFromDate Resident OriginalIntervals;

// Create intervals from single dates.
SubIntervals:
Load SPID, SubFromDate, RecNo() as SubIntervalID,
Dual(SubToDate, SubToDate - $(#vEpsilon)) as SubToDate
Where not IsNull(SubToDate) ;

Load SPID, SubFromDate,
If(SPID = Previous(SPID), Previous(SubFromDate)) as SubToDate
Resident TempSubIntervals
Order By SPID, SubFromDate Desc;
Drop Table TempSubIntervals;
- Mark as New
- Bookmark
- Subscribe
- Mute
- Subscribe to RSS Feed
- Permalink
- Report Inappropriate Content
Hi Gysbert, Could you explain how this method would work for the example I have mentioned above. The link you provided has an example of creating a cartesian product through joining two tables. However I only have one table with the start and end date records for when a machine is low on change. Could you possibly elaborate on how your example could work with my data set? I have also attached an example of the QVW file. Thank you for your help.
- Mark as New
- Bookmark
- Subscribe
- Mute
- Subscribe to RSS Feed
- Permalink
- Report Inappropriate Content
Where are the start and end dates? I don't see any intervals in the document you posted.
talk is cheap, supply exceeds demand
- Mark as New
- Bookmark
- Subscribe
- Mute
- Subscribe to RSS Feed
- Permalink
- Report Inappropriate Content
I have modified the QVW and re-attached it to the original post.
My issue is that I don't have any static start / end intervals. In the updated QVW provided I have two column (side by side) for start and end dates (timestamps) for when an individual machine is 'low on change'.
What I need to calculate is the number of times (and duration) when all machines at a single location are low on change within the same time range (see illustration provided above).
For example, if Site A has 4 machines I need to calculate when all 4 machines at Site A are 'low on change' within the same time range. So the intersect/overlap time would depend on when the last machine (4th machine in this case) is 'low on change' and end when the first (out of four machines) is no longer low on change.
Any help is appreciated. Thanks again
- Mark as New
- Bookmark
- Subscribe
- Mute
- Subscribe to RSS Feed
- Permalink
- Report Inappropriate Content
The description shows 'normal' for all records, not 'low on change', is this expected?
Anyway, it shouldn't make any difference, I just assume that all records describe intervals where the machines are low on change.
See attached for a sample script that implements something like described in HIC's tech doc.
- Mark as New
- Bookmark
- Subscribe
- Mute
- Subscribe to RSS Feed
- Permalink
- Report Inappropriate Content
Hi Swuehl, Your assumption was correct. I reworked the data so each row shows the time frame when a machine is low on change. Thank you for helping and attaching a working example. I actually tried this method based off your earlier post but couldn't get the results I was expecting.
This looks to be along the correct lines of what I am expecting and I believe this might be a case of me not understanding how the interval match is working but the results seem to be inconsistent.
For example, the first interval when all four machines are out of change (from 02/02/2016 10:56:28 to 02/02/2016 10:59:42) seems to be correct because the start dates and end dates match. However the start and end dates for the second interval, which is one second after the previous intervals end date (02/02/2016 10:59:43 to 02/02/2016 11:01:48) don't seem to exist. The interval start date is actually an end date of when a machine is back with change. I would assume all instances when all machines are low on change would start with the a single machines start date and end with a single machines end date (not necessarily the start and end date of the same machine).
Do you have any advice or explanation as to what the data in your QVW is actually showing?
Thanks again.
- Mark as New
- Bookmark
- Subscribe
- Mute
- Subscribe to RSS Feed
- Permalink
- Report Inappropriate Content
I think it's due to the way the IntervalMatch matches into ranges (including limits) resp. how we derived the SubIntervals.
I've added a very small value to the SubIntervalStart just for the match, this seems to fix the issue.