Unlock a world of possibilities! Login now and discover the exclusive benefits awaiting you.
- Qlik Community
- :
- All Forums
- :
- QlikView
- :
- how to show percentage data in age pyramid bar cha...
- Subscribe to RSS Feed
- Mark Topic as New
- Mark Topic as Read
- Float this Topic for Current User
- Bookmark
- Subscribe
- Mute
- Printer Friendly Page
- Mark as New
- Bookmark
- Subscribe
- Mute
- Subscribe to RSS Feed
- Permalink
- Report Inappropriate Content
how to show percentage data in age pyramid bar chart?
Hi
H make a Age Pyramid bar chart like the image. it works good when I show data as integer but when I want to show data in Percent
the left Piece of bar chart shows negative percent data.
what can I do to show all data in positive percent?!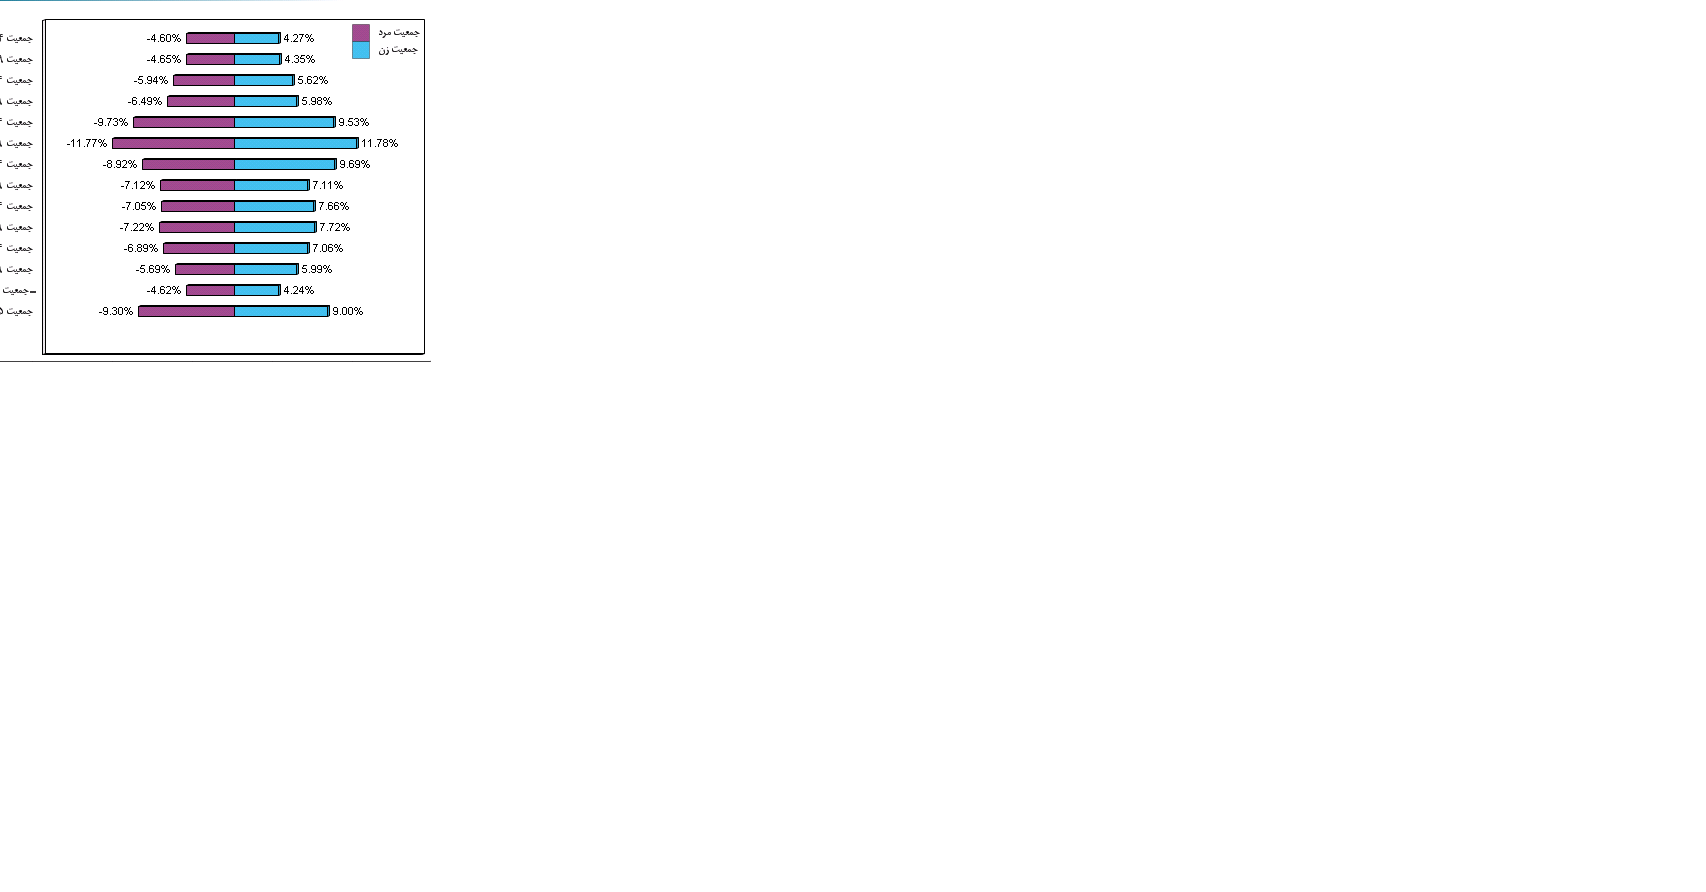
Accepted Solutions
- Mark as New
- Bookmark
- Subscribe
- Mute
- Subscribe to RSS Feed
- Permalink
- Report Inappropriate Content
Ok, I would need to check why my suggestion did not work.
But you can make your approach work by changing the format code in number tab to
#,##0%;#,##0%;
i,e, specifiying a format for the negative values without a minus sign.
- Mark as New
- Bookmark
- Subscribe
- Mute
- Subscribe to RSS Feed
- Permalink
- Report Inappropriate Content
Try using the dual() function, like
=Dual( Num( Count(FIELD) / Count(TOTAL FIELD),'#.00%','.',','), -Count(Field) )
for the left side expression and
=Dual( Num( Count(FIELD) / Count(TOTAL FIELD),'#.00%','.',','), Count(Field) )
for the right side expression.
Disable the 'relative' option.
- Mark as New
- Bookmark
- Subscribe
- Mute
- Subscribe to RSS Feed
- Permalink
- Report Inappropriate Content
I do this but it doesnt work. in this case shoe data in number not percent and show in negative.
- Mark as New
- Bookmark
- Subscribe
- Mute
- Subscribe to RSS Feed
- Permalink
- Report Inappropriate Content
Could you upload a small sample QVW?
- Mark as New
- Bookmark
- Subscribe
- Mute
- Subscribe to RSS Feed
- Permalink
- Report Inappropriate Content
Yes of course. this is my sample.
- Mark as New
- Bookmark
- Subscribe
- Mute
- Subscribe to RSS Feed
- Permalink
- Report Inappropriate Content
Ok, I would need to check why my suggestion did not work.
But you can make your approach work by changing the format code in number tab to
#,##0%;#,##0%;
i,e, specifiying a format for the negative values without a minus sign.
- Mark as New
- Bookmark
- Subscribe
- Mute
- Subscribe to RSS Feed
- Permalink
- Report Inappropriate Content
Thanks so much. this is work goood