Unlock a world of possibilities! Login now and discover the exclusive benefits awaiting you.
Announcements
Accelerate Your Success: Fuel your data and AI journey with the right services, delivered by our experts.
Learn More
- Qlik Community
- :
- Forums
- :
- Analytics
- :
- New to Qlik Analytics
- :
- Fiscal Year Formatting
Options
- Subscribe to RSS Feed
- Mark Topic as New
- Mark Topic as Read
- Float this Topic for Current User
- Bookmark
- Subscribe
- Mute
- Printer Friendly Page
Turn on suggestions
Auto-suggest helps you quickly narrow down your search results by suggesting possible matches as you type.
Showing results for
Not applicable
2016-08-11
11:22 AM
- Mark as New
- Bookmark
- Subscribe
- Mute
- Subscribe to RSS Feed
- Permalink
- Report Inappropriate Content
Fiscal Year Formatting
Hello I am trying to make a line graph on Qlik Sense and the dimension is Fiscal Year (FY) but Qlik is loading the dates as numbers in the thousands (Ex. 2017 is loaded at 2.017 k). Is there a way to format in the data load editor to present it as a year format?
533 Views
2 Replies
2016-08-11
11:52 AM
- Mark as New
- Bookmark
- Subscribe
- Mute
- Subscribe to RSS Feed
- Permalink
- Report Inappropriate Content
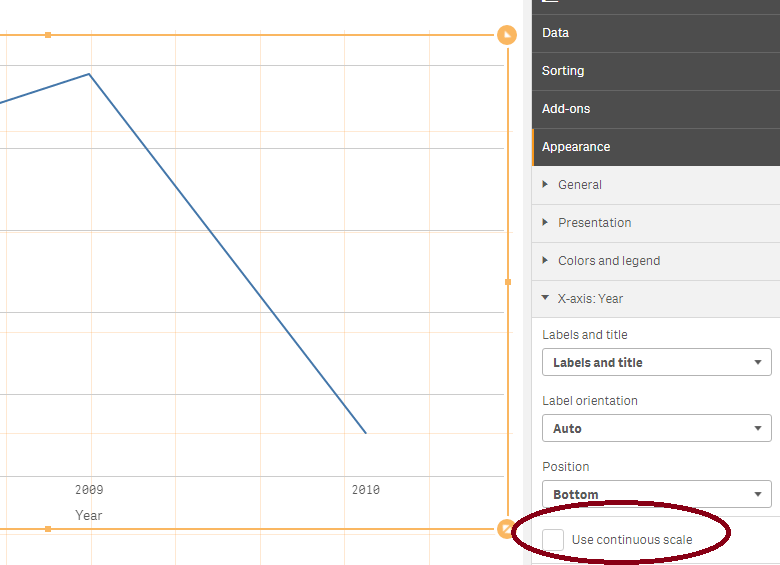
If this is happening in a line chart then disable the Use continuous scale option
talk is cheap, supply exceeds demand
411 Views
Partner - Creator II
2016-08-11
11:53 AM
- Mark as New
- Bookmark
- Subscribe
- Mute
- Subscribe to RSS Feed
- Permalink
- Report Inappropriate Content
Hi Sarah,
You might be working on continuous scale.
Go into presentation and UNTICK the continuous scale.
This will help you.
Mark this helpful if it works.
411 Views
Community Browser