Unlock a world of possibilities! Login now and discover the exclusive benefits awaiting you.
- Qlik Community
- :
- All Forums
- :
- QlikView
- :
- Line chart with two dimensions at x-axis issue....
- Subscribe to RSS Feed
- Mark Topic as New
- Mark Topic as Read
- Float this Topic for Current User
- Bookmark
- Subscribe
- Mute
- Printer Friendly Page
- Mark as New
- Bookmark
- Subscribe
- Mute
- Subscribe to RSS Feed
- Permalink
- Report Inappropriate Content
Line chart with two dimensions at x-axis issue....
Hi all,
I have an issue with line chart, as i am not able to plot two dimensions(Phase&approved date) at x-axis.
i have attached the sample data with mock up chart, Please try to resolve the issue.
Thanks in advance.
Accepted Solutions
- Mark as New
- Bookmark
- Subscribe
- Mute
- Subscribe to RSS Feed
- Permalink
- Report Inappropriate Content
What you want isn't possible in a single line chart. It cannot have two dimensions at the x-axis. You either need to combine the two dimensions into one. Or you can try text-in-chart objects (add those on the Presentation tab) or use Text objects and place them below the line chart.
Here's what it can look like if you use a calculated dimension:
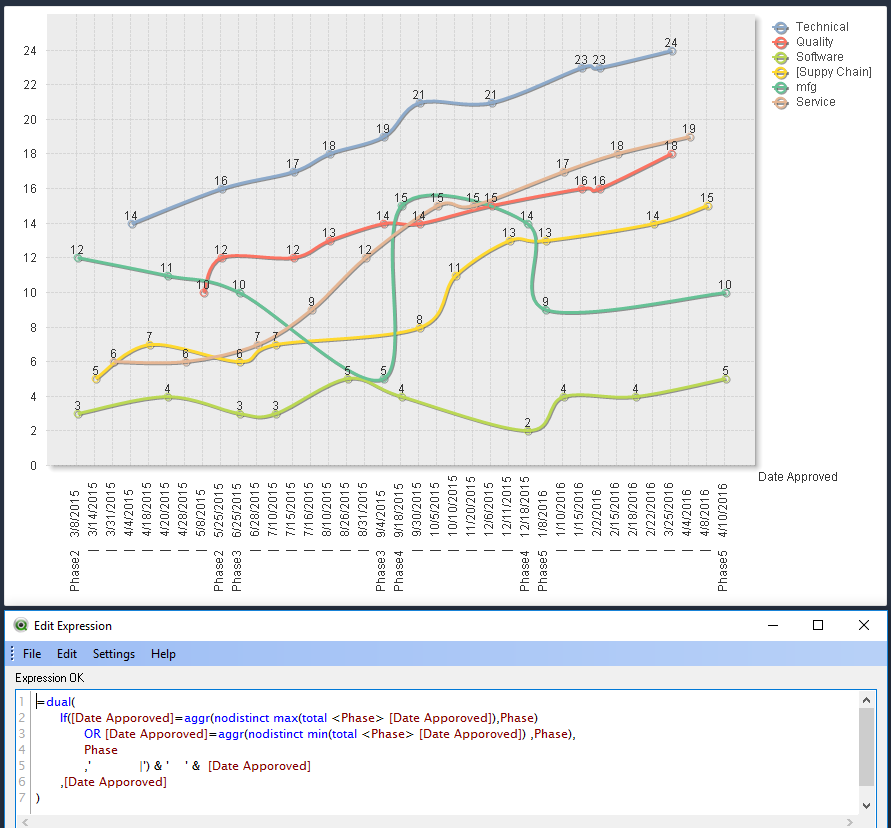
Here's the expression for the calculated dimension:
=dual(
If([Date Apporoved]=aggr(nodistinct max(total <Phase> [Date Apporoved]),Phase)
OR [Date Apporoved]=aggr(nodistinct min(total <Phase> [Date Apporoved]) ,Phase),
Phase
,' |') & ' ' & [Date Apporoved]
,[Date Apporoved]
)
talk is cheap, supply exceeds demand
- Mark as New
- Bookmark
- Subscribe
- Mute
- Subscribe to RSS Feed
- Permalink
- Report Inappropriate Content
What you want isn't possible in a single line chart. It cannot have two dimensions at the x-axis. You either need to combine the two dimensions into one. Or you can try text-in-chart objects (add those on the Presentation tab) or use Text objects and place them below the line chart.
Here's what it can look like if you use a calculated dimension:
Here's the expression for the calculated dimension:
=dual(
If([Date Apporoved]=aggr(nodistinct max(total <Phase> [Date Apporoved]),Phase)
OR [Date Apporoved]=aggr(nodistinct min(total <Phase> [Date Apporoved]) ,Phase),
Phase
,' |') & ' ' & [Date Apporoved]
,[Date Apporoved]
)
talk is cheap, supply exceeds demand
- Mark as New
- Bookmark
- Subscribe
- Mute
- Subscribe to RSS Feed
- Permalink
- Report Inappropriate Content
Thanks gysbert wassenaar..