Unlock a world of possibilities! Login now and discover the exclusive benefits awaiting you.
Announcements
We are aware of an issue with the Product Downloads page and looking into it.
- Qlik Community
- :
- All Forums
- :
- QlikView
- :
- Number of employees month by month
Options
- Subscribe to RSS Feed
- Mark Topic as New
- Mark Topic as Read
- Float this Topic for Current User
- Bookmark
- Subscribe
- Mute
- Printer Friendly Page
Turn on suggestions
Auto-suggest helps you quickly narrow down your search results by suggesting possible matches as you type.
Showing results for
Not applicable
2016-11-14
03:01 AM
- Mark as New
- Bookmark
- Subscribe
- Mute
- Subscribe to RSS Feed
- Permalink
- Report Inappropriate Content
Number of employees month by month
Hi Everyone,
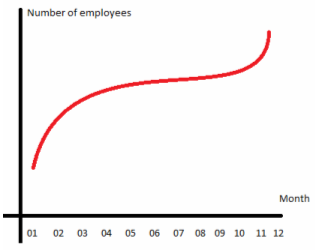
I’m trying to make a human ressources dashboard. I am having issues doing a chart which represents the number of employees month by month.
Here’s a sample of my data :
Name | Date of employment | Date of exit |
| 01/01/2016 | - |
| 05/06/2014 | 31/10/2016 |
| 03/09/2011 | - |
How can I do that ?
I thought about that kind of chart :
Thanks in advance,
1,386 Views
1 Solution
Accepted Solutions
Anonymous
Not applicable
2016-11-14
04:15 AM
Author
- Mark as New
- Bookmark
- Subscribe
- Mute
- Subscribe to RSS Feed
- Permalink
- Report Inappropriate Content
Hi Sarah,
Please find attached the qvw. I have used interval match concept.
Hope this helps you.
1,175 Views
4 Replies
Champion III
2016-11-14
03:10 AM
- Mark as New
- Bookmark
- Subscribe
- Mute
- Subscribe to RSS Feed
- Permalink
- Report Inappropriate Content
Use this dimension and expression
Dim:- Month
Expre:- Count(Name)
Regards
Anand
Anonymous
Not applicable
2016-11-14
04:15 AM
Author
- Mark as New
- Bookmark
- Subscribe
- Mute
- Subscribe to RSS Feed
- Permalink
- Report Inappropriate Content
Hi Sarah,
Please find attached the qvw. I have used interval match concept.
Hope this helps you.
1,176 Views
Not applicable
2016-11-14
04:18 AM
Author
- Mark as New
- Bookmark
- Subscribe
- Mute
- Subscribe to RSS Feed
- Permalink
- Report Inappropriate Content
Thank you very much !
Regards,
Sarah
Anonymous
Not applicable
2016-11-14
04:21 AM
Author
- Mark as New
- Bookmark
- Subscribe
- Mute
- Subscribe to RSS Feed
- Permalink
- Report Inappropriate Content
Most Welcome... 
1,175 Views