Unlock a world of possibilities! Login now and discover the exclusive benefits awaiting you.
- Qlik Community
- :
- All Forums
- :
- QlikView App Dev
- :
- A ratio as a calculated dimension
- Subscribe to RSS Feed
- Mark Topic as New
- Mark Topic as Read
- Float this Topic for Current User
- Bookmark
- Subscribe
- Mute
- Printer Friendly Page
- Mark as New
- Bookmark
- Subscribe
- Mute
- Subscribe to RSS Feed
- Permalink
- Report Inappropriate Content
A ratio as a calculated dimension
Hi all,
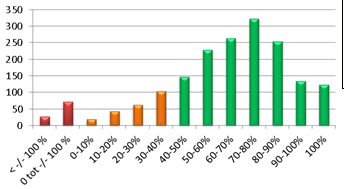
I have a lot of data, Costs and revenues. Together they make margin. What I want is to make a barchart with in the X-axes a categorised margin and in the Y-axis the number of contracts. it is like this:
My epression for the margin is like this:
(SUM({<%Date = {">=$(=MINSTRING({Periode_1}%Date))<=$(=MAXSTRING({Periode_2}%Date))"}>}[Revenue])
- SUM({<%Date = {">=$(=MINSTRING({Periode_1}%Date))<=$(=MAXSTRING({Periode_2}%Date))"}>}[Costs]))
/SUM({<%Date = {">=$(=MINSTRING({Periode_1}%Date))<=$(=MAXSTRING({Periode_2}%Date))"}>}[Revenue])
The expression for the number of contracts is just:
COUNT({<%Date = {">=$(=MINSTRING({Periode_1}%Date))<=$(=MAXSTRING({Periode_2}%Date))"}>}DISTINCT [ContractNo])
Can anyone bring me in the right direction??
Thanks,
Halmar
- Mark as New
- Bookmark
- Subscribe
- Mute
- Subscribe to RSS Feed
- Permalink
- Report Inappropriate Content
you need to create a calculated dimension
the will go something like this
num(subfield(class(aggr(
(SUM({<%Date = {">=$(=MINSTRING({Periode_1}%Date))<=$(=MAXSTRING({Periode_2}%Date))"}>}[Revenue])
- SUM({<%Date = {">=$(=MINSTRING({Periode_1}%Date))<=$(=MAXSTRING({Periode_2}%Date))"}>}[Costs]))
/SUM({<%Date = {">=$(=MINSTRING({Periode_1}%Date))<=$(=MAXSTRING({Periode_2}%Date))"}>}[Revenue]),[ContractNo]),0.1),'<',1),'#,##0%')
and use as expression your expression for counting contracts from above