Unlock a world of possibilities! Login now and discover the exclusive benefits awaiting you.
- Qlik Community
- :
- All Forums
- :
- QlikView
- :
- Problem with value list?
- Subscribe to RSS Feed
- Mark Topic as New
- Mark Topic as Read
- Float this Topic for Current User
- Bookmark
- Subscribe
- Mute
- Printer Friendly Page
- Mark as New
- Bookmark
- Subscribe
- Mute
- Subscribe to RSS Feed
- Permalink
- Report Inappropriate Content
Problem with value list?
Hi Community,
I have a requirement that i need to visualize my data points exactly like the way i have shown in following spread sheet.Here i am using value list to create dummy dimensions with three value valuelist('value1','value2','value3') and i have two expressions.for first expression i want to show the three value value1,value2,value3 but in second expression i only need to values value1 ,value3 to meet my requirement .again if am doing above procedure am geeting 3 values for second expreesion though i didn't not mention it in expression,because its valuelist.So is there any workaround in order to acheive same kind of view as i have in below spread sheet.Kindly help me. Thanks
- Mark as New
- Bookmark
- Subscribe
- Mute
- Subscribe to RSS Feed
- Permalink
- Report Inappropriate Content
can you post some sample data?
If a post helps to resolve your issue, please accept it as a Solution.
- Mark as New
- Bookmark
- Subscribe
- Mute
- Subscribe to RSS Feed
- Permalink
- Report Inappropriate Content
Hi,
Vineeth rights, from ValueList.xls is not very clear idea. Maybe these considerations will help.
In the file qvw there is no data, the database is empty. Constract Chats with valuelist().
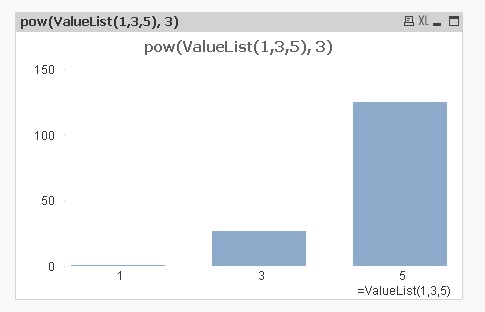
1) Calculation of third degree values of synthetic dimension (all values)
Dimensions: =ValueList(1,3,5)
Expression: pow(ValueList(1,3,5), 3)
Result
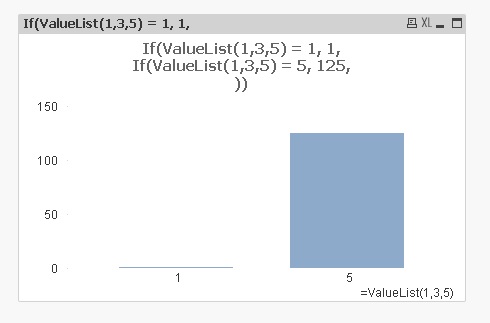
2) Calculation of only specific values for synthetic dimension (only the values indicated in the expression)
Dimensions: =ValueList(1,3,5)
Expression:
If(ValueList(1,3,5) = 1, 1,
If(ValueList(1,3,5) = 5, 125,
))
Result
Maybe your case is described in option 1) and option 2) you need?
Regards,
Andrey
- Mark as New
- Bookmark
- Subscribe
- Mute
- Subscribe to RSS Feed
- Permalink
- Report Inappropriate Content
please post a sample that includes data for all source fields and your expected result.
thanks
regards
Marco
- Mark as New
- Bookmark
- Subscribe
- Mute
- Subscribe to RSS Feed
- Permalink
- Report Inappropriate Content
Marco, I think its a triple post.... qvw sample here: