Unlock a world of possibilities! Login now and discover the exclusive benefits awaiting you.
- Qlik Community
- :
- Forums
- :
- Analytics & AI
- :
- Products & Topics
- :
- Visualization and Usability
- :
- Time Sequence in line chart not in correct order
- Subscribe to RSS Feed
- Mark Topic as New
- Mark Topic as Read
- Float this Topic for Current User
- Bookmark
- Subscribe
- Mute
- Printer Friendly Page
- Mark as New
- Bookmark
- Subscribe
- Mute
- Subscribe to RSS Feed
- Permalink
- Report Inappropriate Content
Time Sequence in line chart not in correct order
Dear All,
I have a set of Data showing the development of certain costs during a period of time.
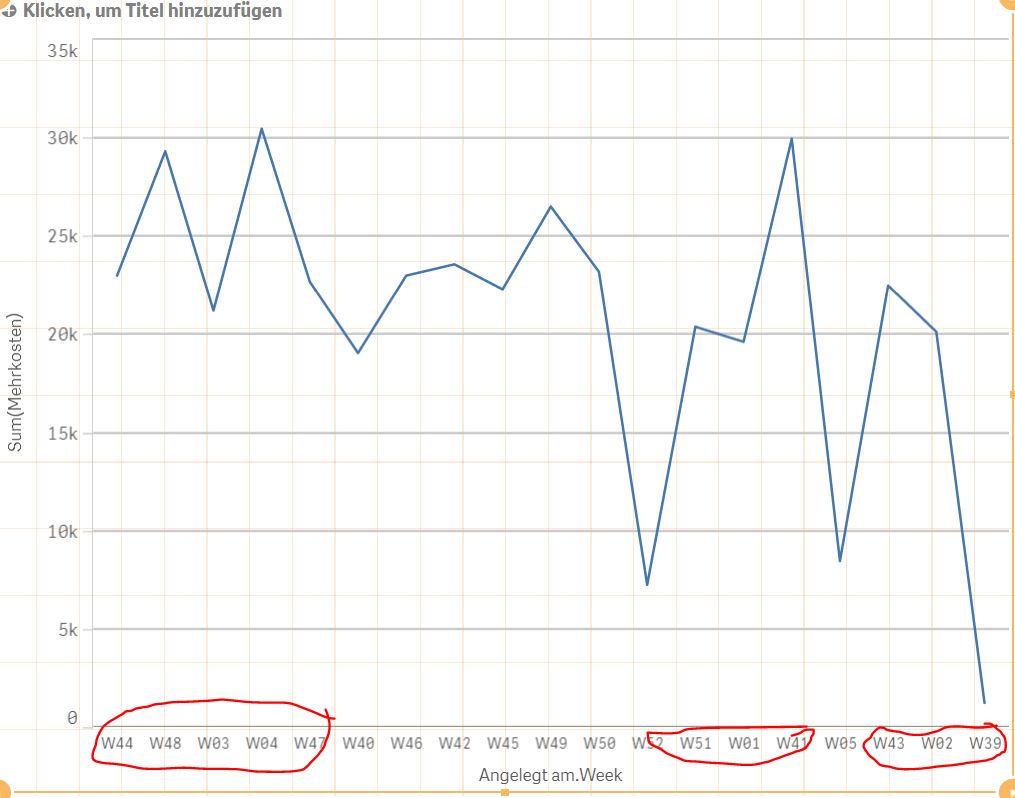
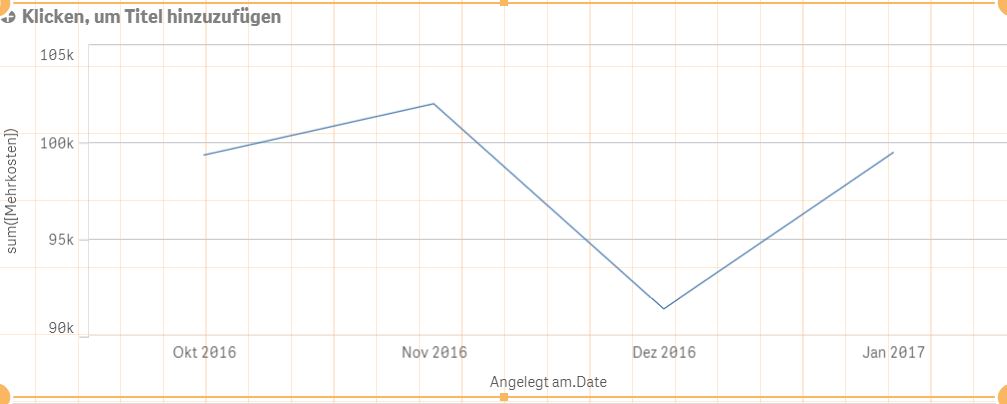
Now when I want to depict the development of these costs in a time series using a line chart somehow the date sequnce gets mixed up, if I use the auto calendar function. If I use "month" instead of "weeks" the diagramm will show Nov, Dez, Jan and the Oktober last, which is obviously incorrect as well. The data is scattered over two calendar years starting in October 16 and then continuing until Jan 2017.
If instead of the autocalendar expression I use the following script:
date(MonthStart([Angelegt am]) , 'MMM YYYY')
It will show the data in the correct sequence. Does anyone has an idea what is the root cause of this issue and how I can make a correct time series showing the data in a weekly instead of monthly development?
Thanks!
Accepted Solutions
- Mark as New
- Bookmark
- Subscribe
- Mute
- Subscribe to RSS Feed
- Permalink
- Report Inappropriate Content
Hi,
issue you have is because you have changed it to Week() formula which drops a timline information from value. As a result of Week() you just get a number 1,2,3....etc up until 52/53 depending on year.
It would be handy if you would create concatenated field like
Dual(
'W-'&Week([Angelegt am])&'/'&Year(Floor([Angelegt am])),
(Year(Floor([Angelegt am]))*100)+Week(Floor([Angelegt am]))
) as WeekYear
then just sort it numericly!
If you just want to display Week number on your scale (for example 34, 35, 36 etc) then each of them will have to be distinguished between different years so then grouping will not be done within just a week, but actualy year/week
regards
- Mark as New
- Bookmark
- Subscribe
- Mute
- Subscribe to RSS Feed
- Permalink
- Report Inappropriate Content
I haven't any experience of the auto-calendar but it might be useful to create an own master-calendar especially if you need more as the few standard calendar-fields. Here you could get many helpful informations about How to use - Master-Calendar and Date-Values.
And if so you could use there for the weeks:
date(floor(weekStart([Angelegt am])) , 'MMM YYYY')
- Marcus
- Mark as New
- Bookmark
- Subscribe
- Mute
- Subscribe to RSS Feed
- Permalink
- Report Inappropriate Content
Sort By Expression Week(Angelegt)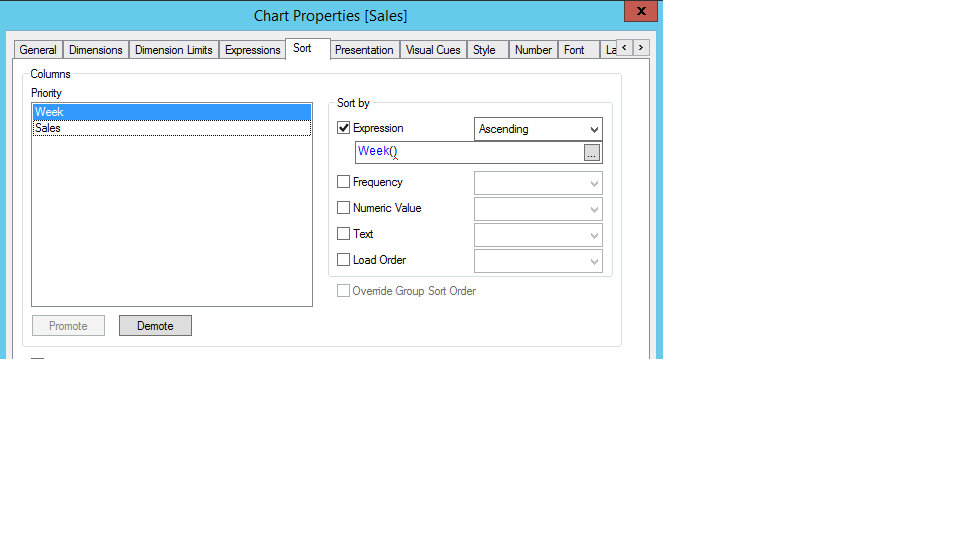
- Mark as New
- Bookmark
- Subscribe
- Mute
- Subscribe to RSS Feed
- Permalink
- Report Inappropriate Content
on top what Marcus suggested i would also add that i like to create dual values for my "text related time dimensions like weeks (W1,W2 etc)
I do it by:
- creting master calendar
- sorting master calendar ascending
- 1 -autonumbering each text related dimension with parameter - that allows me to sort it then numericly (just need to make sure that sorting starts from right point)
- or 2 - applying Dual value for each text value (what by the way happens in your autocalendar which then has to be sorted numericly!
- )
for example
Load
*,
AutoNumber(WeekText,'WeekText') as #WeekText
;
Load Distinct
[Date],
WeekName(Date) as Week,
'W-'&Week(Date) as WeekText
Resident
Sales
Order by
[Date] asc
;
regards
Lech
- Mark as New
- Bookmark
- Subscribe
- Mute
- Subscribe to RSS Feed
- Permalink
- Report Inappropriate Content
Hi Marcus,
thanks, that looks better, I tried to use your formula:
date(floor(weekStart([Angelegt am])) , 'MMM YYYY')
and changed it to
week([Angelegt am],)
because I want to see the calendar week as a dimension. Now it is correctly ordered, i.e. the number of weeks are ascending, but it starts with week one (which is of Jan´17 and the jumps from week 5 to week 39, but week 39 is of Oktober16, so somehow the exact date infomation i.e. the calendar year does not get recognized.
I have to try the Master Calendar hints, maybe this will help,
thanks
- Mark as New
- Bookmark
- Subscribe
- Mute
- Subscribe to RSS Feed
- Permalink
- Report Inappropriate Content
Hi
In the sorting panel select alphabetic order and numeric order also
It should work
Regards
- Mark as New
- Bookmark
- Subscribe
- Mute
- Subscribe to RSS Feed
- Permalink
- Report Inappropriate Content
Hi,
issue you have is because you have changed it to Week() formula which drops a timline information from value. As a result of Week() you just get a number 1,2,3....etc up until 52/53 depending on year.
It would be handy if you would create concatenated field like
Dual(
'W-'&Week([Angelegt am])&'/'&Year(Floor([Angelegt am])),
(Year(Floor([Angelegt am]))*100)+Week(Floor([Angelegt am]))
) as WeekYear
then just sort it numericly!
If you just want to display Week number on your scale (for example 34, 35, 36 etc) then each of them will have to be distinguished between different years so then grouping will not be done within just a week, but actualy year/week
regards