Unlock a world of possibilities! Login now and discover the exclusive benefits awaiting you.
- Qlik Community
- :
- All Forums
- :
- QlikView
- :
- which Qlikview chart Use??
- Subscribe to RSS Feed
- Mark Topic as New
- Mark Topic as Read
- Float this Topic for Current User
- Bookmark
- Subscribe
- Mute
- Printer Friendly Page
- Mark as New
- Bookmark
- Subscribe
- Mute
- Subscribe to RSS Feed
- Permalink
- Report Inappropriate Content
which Qlikview chart Use??
Hello,
i need to disply sales in pourcentage with 2 dimensions (City and Product type) like this :
Product type = SIDI ALI and City = * (All cities are included)
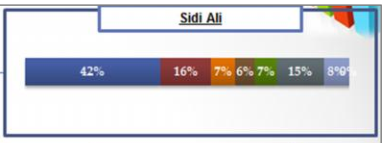
which chart should I use?? i tested bar chart and mekko chart but it doesnt work
Thank you in advance
Accepted Solutions
- Mark as New
- Bookmark
- Subscribe
- Mute
- Subscribe to RSS Feed
- Permalink
- Report Inappropriate Content
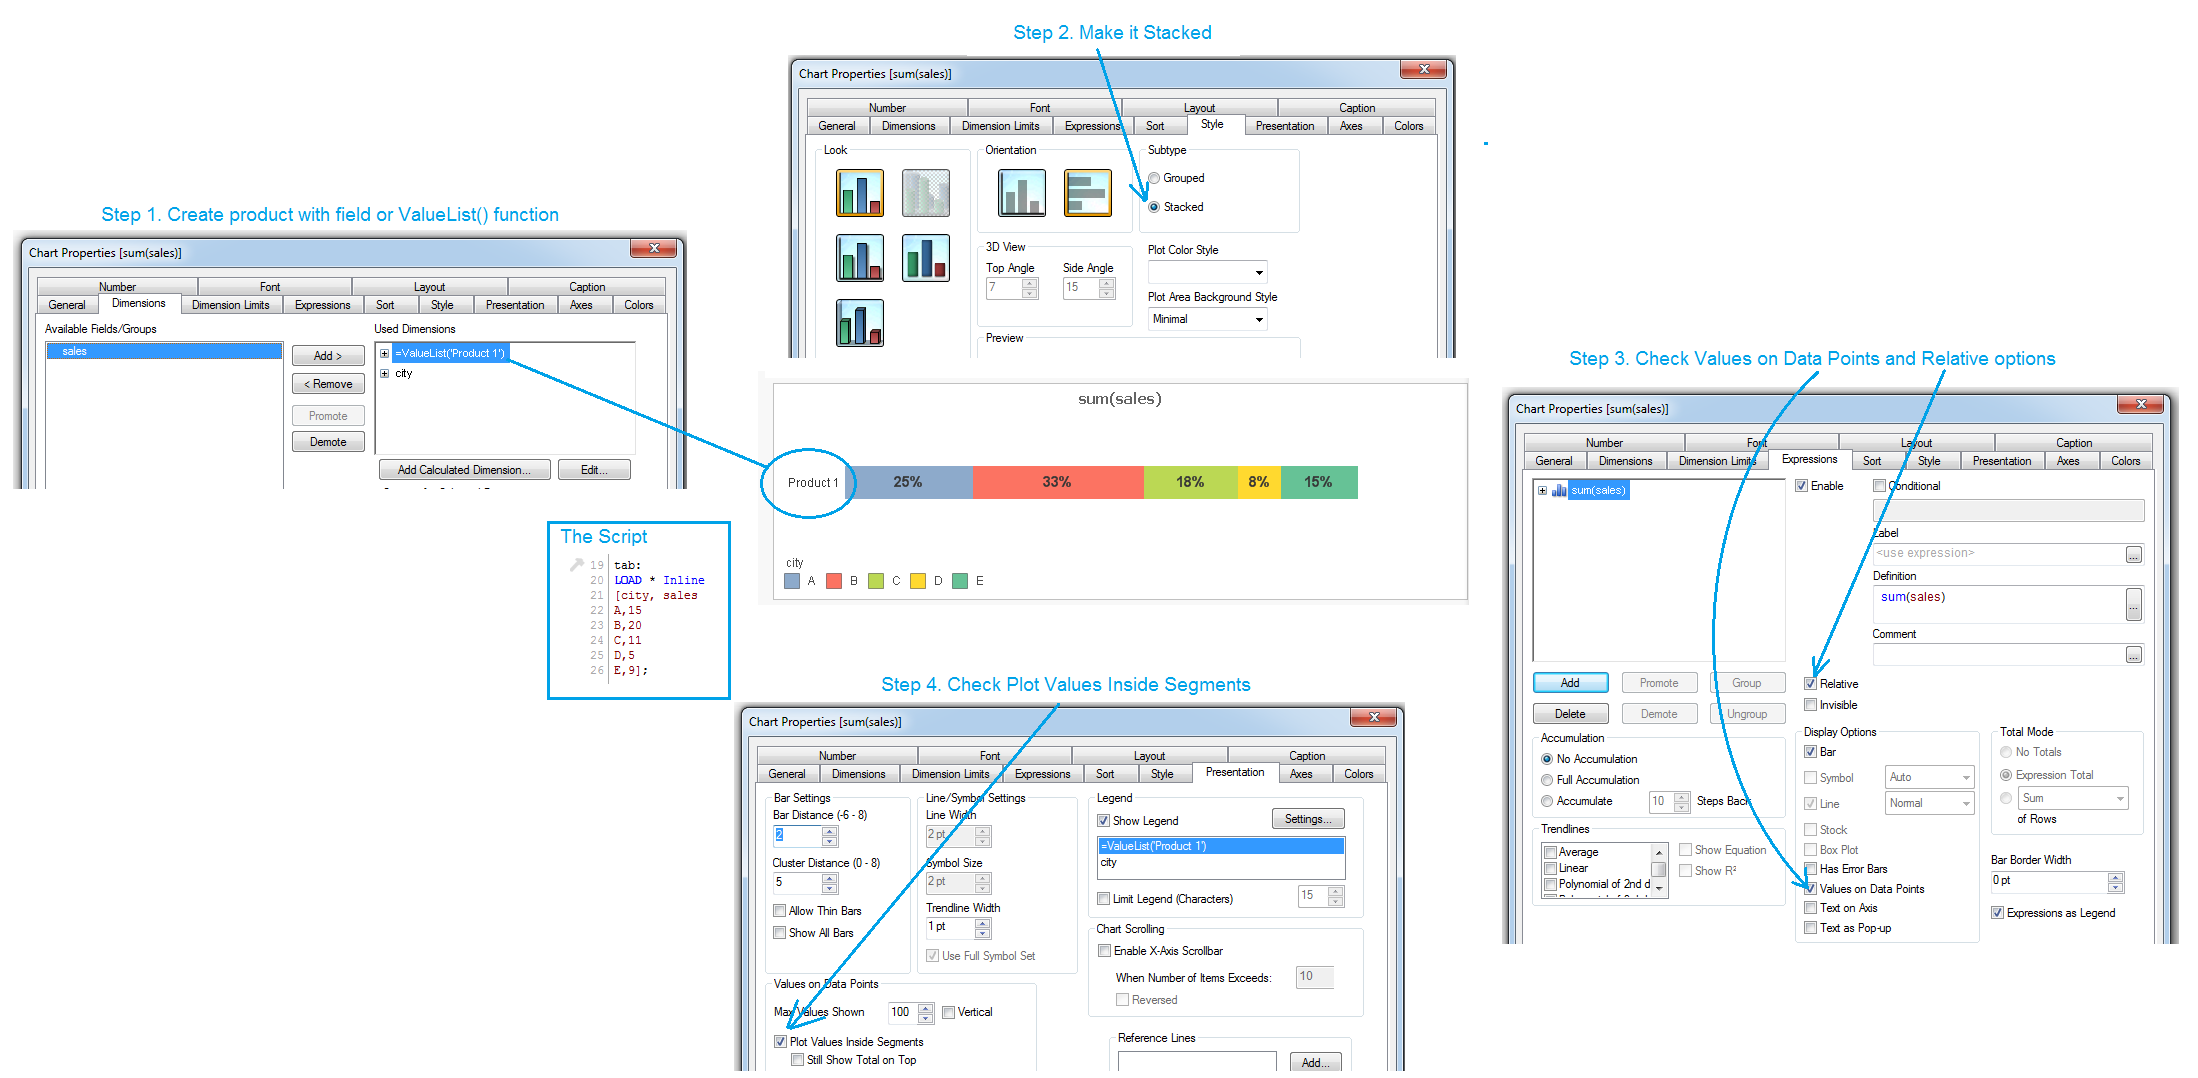
Hello!
You can find different solutions as well in the picture below as in the attachement:
- Mark as New
- Bookmark
- Subscribe
- Mute
- Subscribe to RSS Feed
- Permalink
- Report Inappropriate Content
Hello!
You can find different solutions as well in the picture below as in the attachement:
- Mark as New
- Bookmark
- Subscribe
- Mute
- Subscribe to RSS Feed
- Permalink
- Report Inappropriate Content
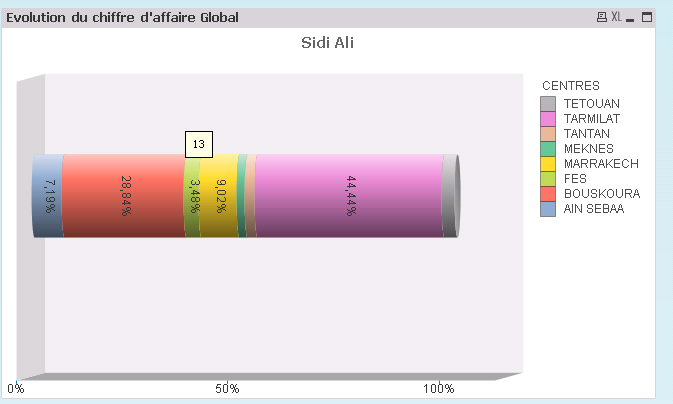
Thank you so much your solution works fine,
but i still have a little probleme, not all the pourcentage are written on the chart, for those who are small, they simply don't appear on the chart how can i solve this ?
do i need to resize the chart or something else ?
thank you in advance
- Mark as New
- Bookmark
- Subscribe
- Mute
- Subscribe to RSS Feed
- Permalink
- Report Inappropriate Content
Hello!
Thank you for marking my answer as correct 😃
There are some workaround ways for showing small values, and this should be the easiest:
You can add an extra string to city-dimension values, like:
city &' ('& num(aggr(sum(sales),city)/aggr(sum(total sales),city),'0.0%')&')'
Note: you must do it in the dimensions tab (select "city" dimension and click on Edit button)
After that your legend will be shown as: A (25%) B (33%) and so on.
- Mark as New
- Bookmark
- Subscribe
- Mute
- Subscribe to RSS Feed
- Permalink
- Report Inappropriate Content
Thank You for your anwser,
Well I can add the values beside the legend like you mention, but what the final user want is to display the values on the bar chart even if its small values
Thank you in advance.
- Mark as New
- Bookmark
- Subscribe
- Mute
- Subscribe to RSS Feed
- Permalink
- Report Inappropriate Content
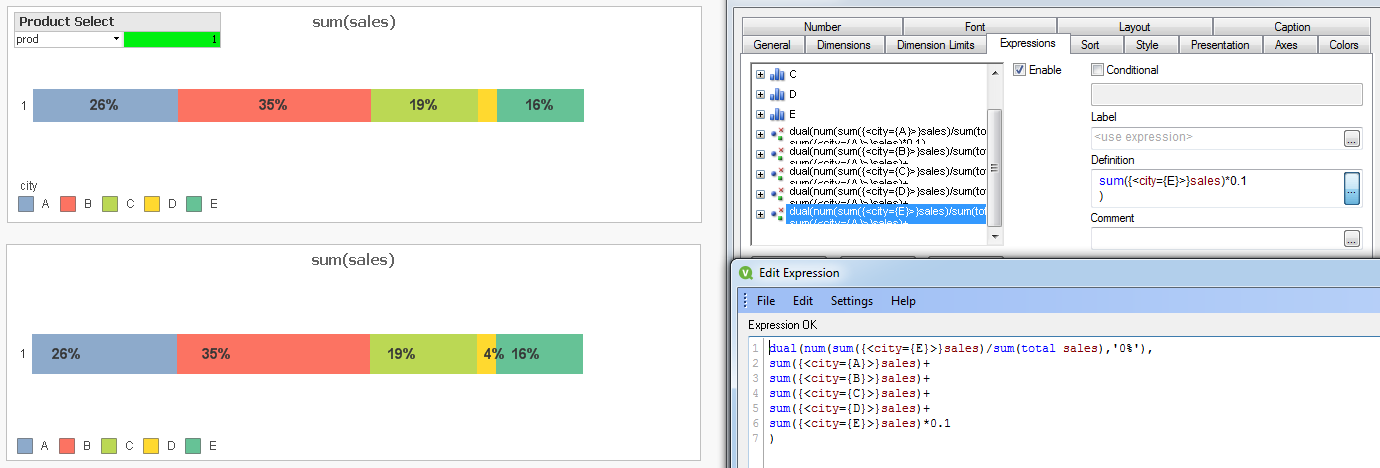
Ok, if User wish we should make a dish...
If you have fixed number of cities so you can make a couple expressions and result will be:
- Mark as New
- Bookmark
- Subscribe
- Mute
- Subscribe to RSS Feed
- Permalink
- Report Inappropriate Content
thank you so much for your answer, but i didn't really understand what the expressions you add do exactly.
Thank You.
- Mark as New
- Bookmark
- Subscribe
- Mute
- Subscribe to RSS Feed
- Permalink
- Report Inappropriate Content
First five expressions with bar icon - it's a bar for each city (defined by set analysis).
Next five expressions with dots icon - it's a dot with value for each city. Dots values are always shown so we can use them as values for each bar even for the smallest ones.
But we can't use the values as they are, so we should use Dual() function for indicating a visible value (percentage string) and a numeric value (where dot must be placed).
This is why it works only if you have fixed number of cities - you must define all values and bars manualy.
- Mark as New
- Bookmark
- Subscribe
- Mute
- Subscribe to RSS Feed
- Permalink
- Report Inappropriate Content
tkank you so much, i will try your solution.
the number of cities are fixed for the moment , but new values can be added in the future;
thank you