Unlock a world of possibilities! Login now and discover the exclusive benefits awaiting you.
- Qlik Community
- :
- Forums
- :
- Analytics
- :
- App Development
- :
- Color by expression
- Subscribe to RSS Feed
- Mark Topic as New
- Mark Topic as Read
- Float this Topic for Current User
- Bookmark
- Subscribe
- Mute
- Printer Friendly Page
- Mark as New
- Bookmark
- Subscribe
- Mute
- Subscribe to RSS Feed
- Permalink
- Report Inappropriate Content
Color by expression
Hi,
I was wondering whether you guys knew how to color data in bar charts different colors depending on which sheet the data comes from.
For example would i like to color data in a bar chart from sheet1 Yellow and data from sheet1-1 gray.
- Mark as New
- Bookmark
- Subscribe
- Mute
- Subscribe to RSS Feed
- Permalink
- Report Inappropriate Content
Hi,
you should go the properties of each object, choose customized colors and color by expression:
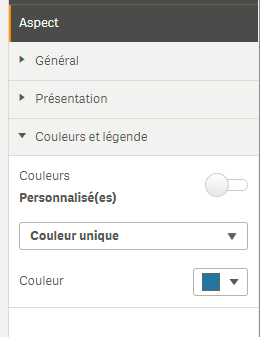
and on the expression part, you can use RGB() function, to set differents colors on each barchart object
- Mark as New
- Bookmark
- Subscribe
- Mute
- Subscribe to RSS Feed
- Permalink
- Report Inappropriate Content
Are you talking about a sheet in Qlik Sense or a sheet in an Excel workbook?
Qlik Sense does not organize it's data in the data model by sheet like Excel does. So any sheet in Qlik Sense can use the same data model - the entire data model.
- Mark as New
- Bookmark
- Subscribe
- Mute
- Subscribe to RSS Feed
- Permalink
- Report Inappropriate Content
I'm talking about two different excel sheets
- Mark as New
- Bookmark
- Subscribe
- Mute
- Subscribe to RSS Feed
- Permalink
- Report Inappropriate Content
You can create flags on the tables load like this:
Table1:
load
.
'Sheet1' as Flag,
.
From ...Sheet1...
after you can do what i have mentioned above, like this:
if(Flag='Sheet1', rgb(X,X,X) ) on the coloring expression
- Mark as New
- Bookmark
- Subscribe
- Mute
- Subscribe to RSS Feed
- Permalink
- Report Inappropriate Content
Where do i create flags ?
- Mark as New
- Bookmark
- Subscribe
- Mute
- Subscribe to RSS Feed
- Permalink
- Report Inappropriate Content
on the script, on the Load part
is it clear ?