Unlock a world of possibilities! Login now and discover the exclusive benefits awaiting you.
- Qlik Community
- :
- Forums
- :
- Analytics
- :
- New to Qlik Analytics
- :
- donut chart with multiple dimensions
- Subscribe to RSS Feed
- Mark Topic as New
- Mark Topic as Read
- Float this Topic for Current User
- Bookmark
- Subscribe
- Mute
- Printer Friendly Page
- Mark as New
- Bookmark
- Subscribe
- Mute
- Subscribe to RSS Feed
- Permalink
- Report Inappropriate Content
donut chart with multiple dimensions
Hi,
I am new to qlik sense and have started working on creating two new charts and i am not sure how to design them in Qlik sense.
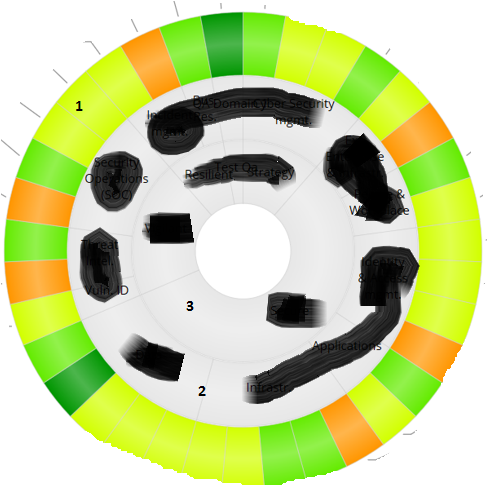
1. Donut Chart: This chart shows 3 level of dimensions in with different color coding. Levels have been numbered on each level. Please find the screenshot below.
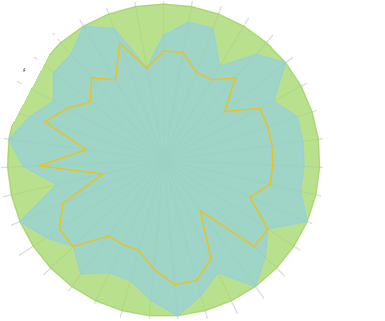
2. Unknown Chart Type: I have never come across such kind of chart type. Please find the screenshot below.
Need help to achieve this kind reports in Qlik sense. Thanks.
Regards.
- Mark as New
- Bookmark
- Subscribe
- Mute
- Subscribe to RSS Feed
- Permalink
- Report Inappropriate Content
Hello Asshay,
Out of the box, Qlik Sense does not have these chart types, however you may be able to find extensions on Qlik Branch that will allow you to build out these charts.
And your unknown chart type, I'm not certain, but it looks like it could be a radar chart.
Here is a extension that will allow you to build interactive radar charts: http://branch.qlik.com/#!/project/56728f52d1e497241ae698cf
And here is an extension that will allow you to build various chart types, including radar charts: http://branch.qlik.com/#!/project/58cf59cd61d353a813f4a37e
I hope that helps,
Serina
When applicable please mark the appropriate replies as CORRECT. This will help community members and Qlik Employees know which discussions have already been addressed and have a possible known solution. Please mark threads as HELPFUL if the provided solution is helpful to the problem, but does not necessarily solve the indicated problem. You can mark multiple threads as HELPFUL if you feel additional info is useful to others.