Unlock a world of possibilities! Login now and discover the exclusive benefits awaiting you.
- Qlik Community
- :
- Forums
- :
- Analytics
- :
- New to Qlik Analytics
- :
- Base lines in chart, based on standart deviation
- Subscribe to RSS Feed
- Mark Topic as New
- Mark Topic as Read
- Float this Topic for Current User
- Bookmark
- Subscribe
- Mute
- Printer Friendly Page
- Mark as New
- Bookmark
- Subscribe
- Mute
- Subscribe to RSS Feed
- Permalink
- Report Inappropriate Content
Base lines in chart, based on standart deviation
Hi! I want add to my linear chart , that represents sales sum by day, following base lines:
average per day, average per day + 3 standart deviation (upper baseline), average per day - 3 standart deviation (lower baseline).
Here is my result:

As you can see, upper and lower baselines is -6.93k and 78.83k. All values is in range. But i'm espect to see something like this:
My measure: sum({$<Eantity={"Sales"}, DateType={"Sales_Дата"}, Mode={"STD"}>} [Sales.Sum])
Avg Baseline: avg(aggr(sum({$<Eantity={"Sales"}, DateType={"Sales_Дата"}, Mode={"STD"}>} [Sales.Sum]), Day)
Stdev Formula: stdev(aggr(sum({$<Eantity={"Sales"}, DateType={"Sales_Дата"}, Mode={"STD"}>} [Sales.Sum]), Day)
Day - dimension in main calendar table. Not all Days have Sales.Sum value.
DateType - field in main calendar, that makes aggregation om concret date type, like:"DealCreate" or "DealClose". remoning that condition from set analysis don't change anything.
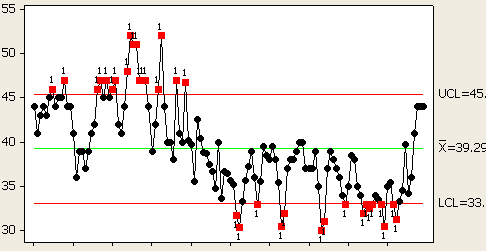
Why lower baseline below zero, if there is no negative value in Sales.Sum? May be I need calculate it in another way?
Result, that i want - Excellent Analytics Tip #9: Leverage Statistical Control Limits - Occam's Razor by Avinash Kaushik