Unlock a world of possibilities! Login now and discover the exclusive benefits awaiting you.
- Qlik Community
- :
- Forums
- :
- Analytics
- :
- New to Qlik Analytics
- :
- Color expression in if statement along with condit...
- Subscribe to RSS Feed
- Mark Topic as New
- Mark Topic as Read
- Float this Topic for Current User
- Bookmark
- Subscribe
- Mute
- Printer Friendly Page
- Mark as New
- Bookmark
- Subscribe
- Mute
- Subscribe to RSS Feed
- Permalink
- Report Inappropriate Content
Color expression in if statement along with condition in kpi
Attached is a sample excel sheet,
i want a value in red and green color in the KPI,
I'm using the below expression to achieve the same, but not finding the result.
if(E<0,-(E) and red(), 0 and green())
What i'm trying is , if the value of E is less than zero or negative, i am making E positive and i want that to be in red() color and if the value of E is greater than or equal to zero and positive i'm making E to be Zero and i want that to be in green(). but the above expression yields - sometimes.
can anyone help me out stalwar1.png)
- Mark as New
- Bookmark
- Subscribe
- Mute
- Subscribe to RSS Feed
- Permalink
- Report Inappropriate Content
Hi,
So what if you for your Dimension do:
IF(Value>= 0,0,Value)
And for your Color Expression do:
IF(Value <= 0,Red(),Green())
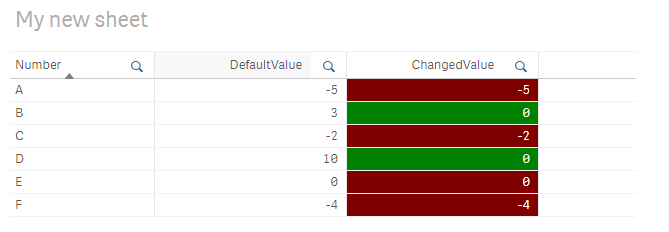
Does that work?
Would do the 0 replacement in script.
Best,
Ali A
- Mark as New
- Bookmark
- Subscribe
- Mute
- Subscribe to RSS Feed
- Permalink
- Report Inappropriate Content
I want in KPI, not in table. Can you suggest it for sheet which i have shared
- Mark as New
- Bookmark
- Subscribe
- Mute
- Subscribe to RSS Feed
- Permalink
- Report Inappropriate Content
Hi,
Take a look at this thread, it may supply you with the information you need.
How to show the different colors according to the value displayed in a KPI???
Regards,
Robin