Unlock a world of possibilities! Login now and discover the exclusive benefits awaiting you.

- Qlik Community
- :
- All Forums
- :
- QlikView
- :
- Vertical line/marker in a line chart
- Subscribe to RSS Feed
- Mark Topic as New
- Mark Topic as Read
- Float this Topic for Current User
- Bookmark
- Subscribe
- Mute
- Printer Friendly Page

 ekech_infomotio
- Mark as New
- Bookmark
- Subscribe
- Mute
- Subscribe to RSS Feed
- Permalink
- Report Inappropriate Content
Vertical line/marker in a line chart
I am trying to build something like a timeline, showing a KPI over the time. simple Line-chart, first dimension is the time from past to future, second dimension is the department, expression is a simple sum. Now I want to mark some specific days with vertical lines. How can I achieve this (Values are available as fields in an DataIsland or as variables)?
Accepted Solutions

 matt_crowther
- Mark as New
- Bookmark
- Subscribe
- Mute
- Subscribe to RSS Feed
- Permalink
- Report Inappropriate Content
I'm assuming you mean something like the following:
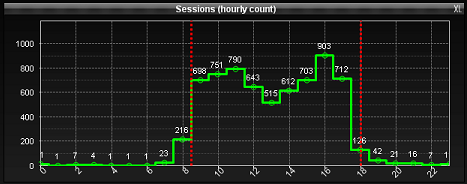
If so you need to add Reference Lines Object properties > Presentation > Reference Lines where you can set the position via an expression. The key thing is that the X-Axis must be set to 'Continuous' under the 'Axes' tab.
Hope that's of use,
Matt - Visual Analytics Ltd
@QlikviewBI
matt_crowther
- Mark as New
- Bookmark
- Subscribe
- Mute
- Subscribe to RSS Feed
- Permalink
- Report Inappropriate Content
I'm assuming you mean something like the following:
If so you need to add Reference Lines Object properties > Presentation > Reference Lines where you can set the position via an expression. The key thing is that the X-Axis must be set to 'Continuous' under the 'Axes' tab.
Hope that's of use,
Matt - Visual Analytics Ltd
@QlikviewBI
ekech_infomotio
- Mark as New
- Bookmark
- Subscribe
- Mute
- Subscribe to RSS Feed
- Permalink
- Report Inappropriate Content
@Matt: Thanks - some things are really simple if you find the right options 

 gino2780
- Mark as New
- Bookmark
- Subscribe
- Mute
- Subscribe to RSS Feed
- Permalink
- Report Inappropriate Content
Sorry for answering to an old thread. Is the option "vertical line/marker" also available for QlikSense?
