Unlock a world of possibilities! Login now and discover the exclusive benefits awaiting you.
- Qlik Community
- :
- All Forums
- :
- QlikView App Dev
- :
- Help! How to break off the line in a chart?
- Subscribe to RSS Feed
- Mark Topic as New
- Mark Topic as Read
- Float this Topic for Current User
- Bookmark
- Subscribe
- Mute
- Printer Friendly Page
- Mark as New
- Bookmark
- Subscribe
- Mute
- Subscribe to RSS Feed
- Permalink
- Report Inappropriate Content
Help! How to break off the line in a chart?
Hi All,
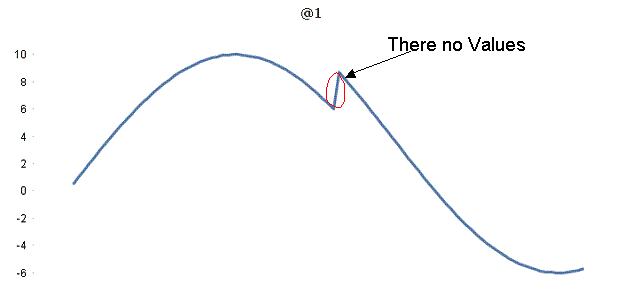
i have a table of numbers with empty cells, like this (part of table)
| Header 1 | Header 2 |
|---|---|
6.75463180551151 | 48 |
| 6.37764702134504 | 49 |
| 5.98472144103957 | 50 |
| 51 | |
| 52 | |
| 8.72030541289883 | 53 |
8.2737988023383 | 54 |
| 7.81660992052332 | 55 |
and i make chart for the table, it looks like this (also see attachment)

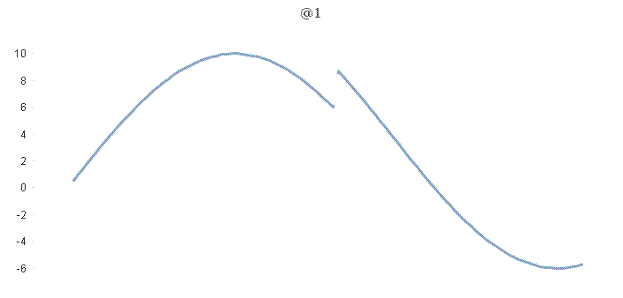
i would like the chart looks like this (i.e. with the break where we have no values)

How can i do it? (i am working in QV 10)
- Tags:
- new_to_qlikview
Accepted Solutions
- Mark as New
- Bookmark
- Subscribe
- Mute
- Subscribe to RSS Feed
- Permalink
- Report Inappropriate Content
- Mark as New
- Bookmark
- Subscribe
- Mute
- Subscribe to RSS Feed
- Permalink
- Report Inappropriate Content
See attached qvw.
talk is cheap, supply exceeds demand
- Mark as New
- Bookmark
- Subscribe
- Mute
- Subscribe to RSS Feed
- Permalink
- Report Inappropriate Content
Thank you, Gysbert
- Mark as New
- Bookmark
- Subscribe
- Mute
- Subscribe to RSS Feed
- Permalink
- Report Inappropriate Content
Hi Gysbert,
I have the same problem, but unfortunately I'm not able to open your file.
Could you please descripe what to do? It would help me a lot!
Thank you in advance!
Sandra
- Mark as New
- Bookmark
- Subscribe
- Mute
- Subscribe to RSS Feed
- Permalink
- Report Inappropriate Content
Hi Gysbert,
I am able to open your file, and this looks like an excellent solution.
Are you able to describe the exact settings of the chart that solve this issue?
Thanks