Unlock a world of possibilities! Login now and discover the exclusive benefits awaiting you.
- Qlik Community
- :
- All Forums
- :
- QlikView
- :
- MULTIPLE STACKED BARS CHART
- Subscribe to RSS Feed
- Mark Topic as New
- Mark Topic as Read
- Float this Topic for Current User
- Bookmark
- Subscribe
- Mute
- Printer Friendly Page
- Mark as New
- Bookmark
- Subscribe
- Mute
- Subscribe to RSS Feed
- Permalink
- Report Inappropriate Content
MULTIPLE STACKED BARS CHART
hello everybody.
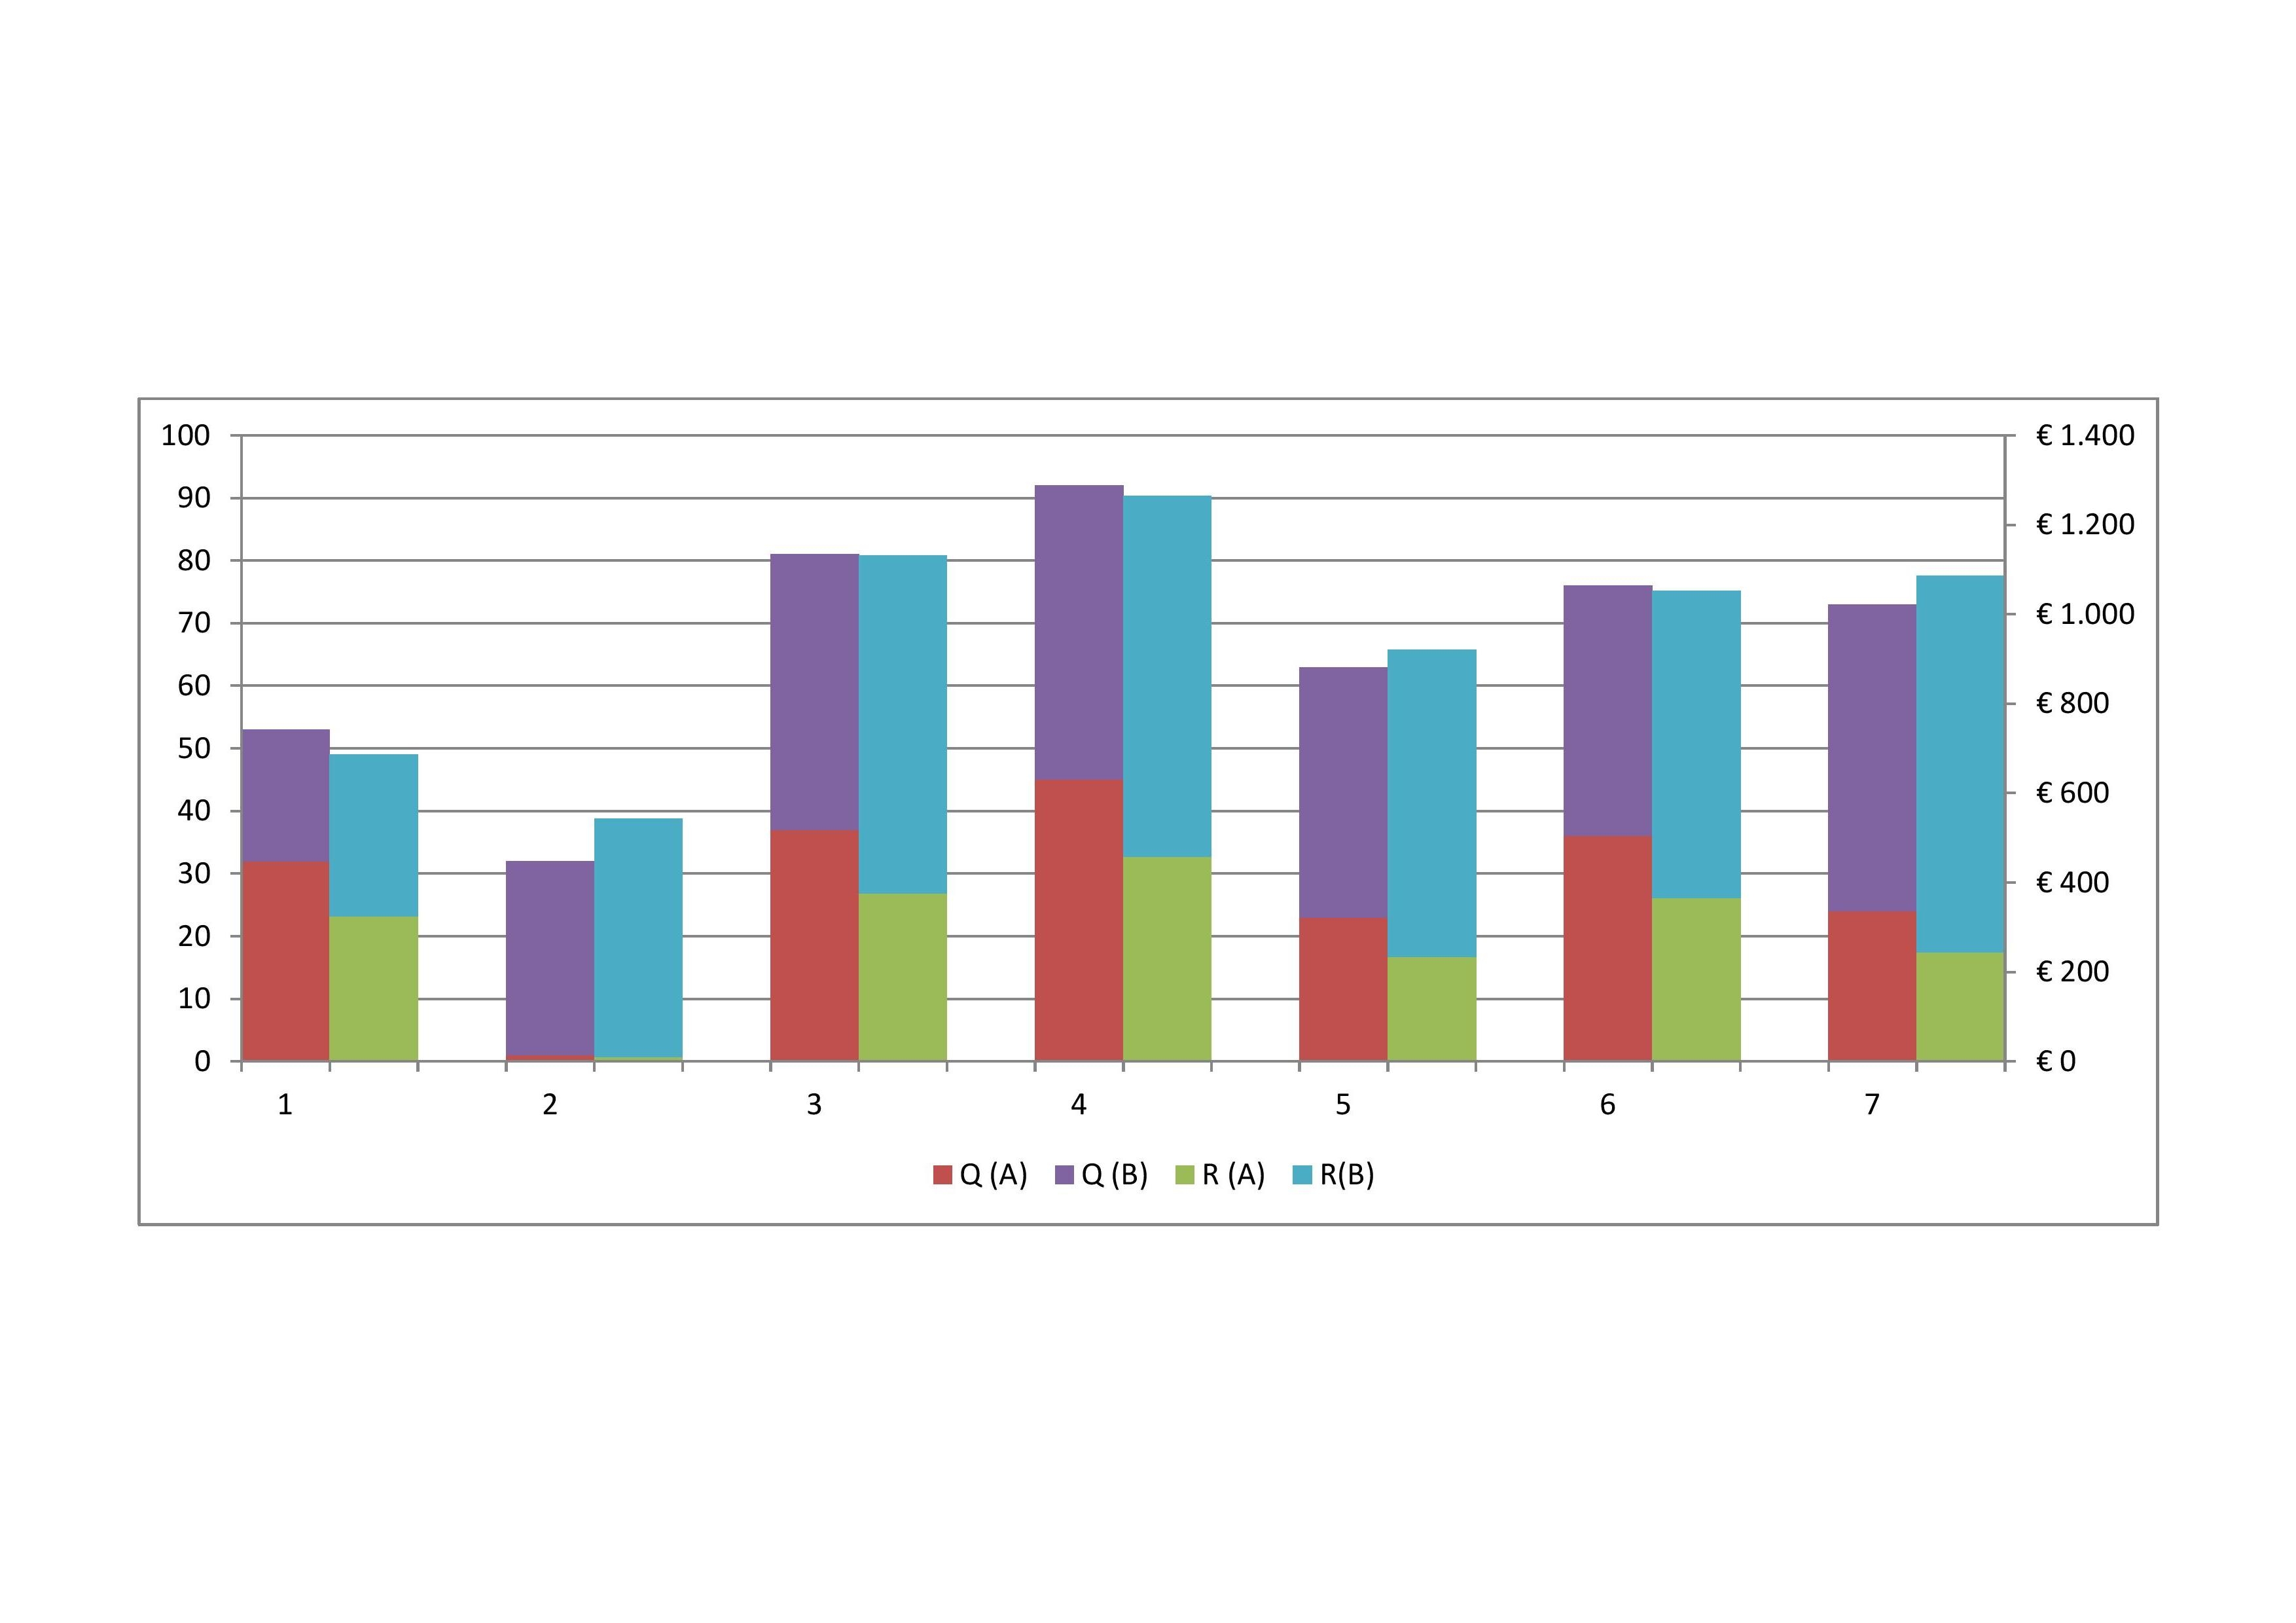
let's suppose i have two products (A & B), their quantities (Qa & Qb) and the revenues (Ra &Rb); a set of Brands/Companies selling these same two products and data in an interval of 7 months (for example)
i'd like to create a multiple stacked bar chart as attached: on the x-axis months, primary y-axis (left) quantities and secondary y-axis (right) revenues; the Brand/Company should act like a global filter to focus on each single enterprise performance.
could you help me?
- Mark as New
- Bookmark
- Subscribe
- Mute
- Subscribe to RSS Feed
- Permalink
- Report Inappropriate Content
See attached example. It uses a valuelist as calculated dimension. It also uses an expression for setting the colors of the segments. Click on the + in front of the expression and then select Background Color.
talk is cheap, supply exceeds demand
- Mark as New
- Bookmark
- Subscribe
- Mute
- Subscribe to RSS Feed
- Permalink
- Report Inappropriate Content
thanx. i'v worked around your suggestion... talking about the qvw test file you posted:i'd need to set the yellow/red bars in a different scale, i.e. on a secondary axis (y-axis). bye