Unlock a world of possibilities! Login now and discover the exclusive benefits awaiting you.
- Qlik Community
- :
- All Forums
- :
- QlikView
- :
- YTD calculation in QlikView - Simple Example neede...
- Subscribe to RSS Feed
- Mark Topic as New
- Mark Topic as Read
- Float this Topic for Current User
- Bookmark
- Subscribe
- Mute
- Printer Friendly Page
- Mark as New
- Bookmark
- Subscribe
- Mute
- Subscribe to RSS Feed
- Permalink
- Report Inappropriate Content
YTD calculation in QlikView - Simple Example needed..
Hello friends,
Just wondering if there is a simple step by step example covering how to do YTD calculations using set analysis.
I've set up a mock data set that kinda replicates my data structure in the attached xlsx.
This is a deliberately dumbed down example extracted from a far more complex DWH just so I can nut out how to do this.
Obviously I am trying to retreive base numbers from both years as well as a MTD number for each month.
Currently trying to do what should be a reasonably simple YTD calculation on a single measure column and finding this impossibly difficult!
Examples I've looked at - (amongst others)
a) http://community.qlik.com/message/363423
b) http://community.qlik.com/docs/DOC-4321
ATM I am trying the this formula from example b) above -
sum({$<Year = {$(=max(Year))}, Month = {"<=$(=max({<Year={$(=max(Year))}>} MonthNumber))>$(=max({<Year={$(=max(Year))}>} MonthNumber)-1)"}>} Value)
which btw seems incredibly convoluted for something like this but then again being new to this possibly this is just 'culture shock'..
Also, is there an easy way to learn this - syntax seems incredibly difficult to understand for the more complex cases!
I must also add I am using the Free edition of QV Desktop for evaluation purposes.
Any help would be great!
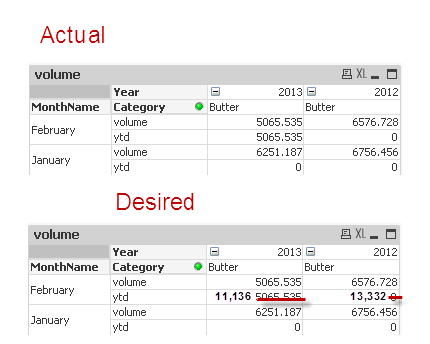
(quick screen shot below of actual / desired results)
I am not posting the qvw since I wanted to figure out the best way to do this rather than a altered version of my (flawed) attempt!
Thanks
- Mark as New
- Bookmark
- Subscribe
- Mute
- Subscribe to RSS Feed
- Permalink
- Report Inappropriate Content
Nope, no dice still same result I am afraid..and formula is still quite complex, and has a number of wrong fields in it anyway e.g. I don;t have Sale or YearStart fields as per the attached spreadsheet.
I am reading through chap 10 of "QlikView 11 for Developers" to see if this is any good however this is also proving to be hard going due to the arcane syntax.
it would be nice if we could 'debug' & step thru QV formulas - like current 4th gen languages!
- Mark as New
- Bookmark
- Subscribe
- Mute
- Subscribe to RSS Feed
- Permalink
- Report Inappropriate Content
CY =num(sum({$<Year = {$(=max(Year))}, Month = {"<=$(=max({<Year={$(=max(Year))}>} Month))"}>} LineSalesAmount), '$#,##0;($#,##0)')
LY =num(sum({$<Year = {$(=max(Year-1))}, Month = {"<=$(=max({<Year={$(=max(Year))}>} Month))"}>} LineSalesAmount), '$#,##0;($#,##0)')
Try This and let me know if any other help is required
Regards
Himanshu
Skype id himanshu_sethi
- Mark as New
- Bookmark
- Subscribe
- Mute
- Subscribe to RSS Feed
- Permalink
- Report Inappropriate Content
You're using the month as a dimension in your chart. That means set analysis expressions are not really an option. You can try using an AsOf table. Read this document: Calculating rolling n-period totals, averages or other aggregations
talk is cheap, supply exceeds demand
- Mark as New
- Bookmark
- Subscribe
- Mute
- Subscribe to RSS Feed
- Permalink
- Report Inappropriate Content
Thanks, I'll give this & Himanshu's suggestions a shot and read thru the document you link to.
In your experience there fore is the above pivot even possible to create in QlikView - this is actually an attempt to port a SSRS 2005(!) report to QlikView, and honestly I did not expect this to be as complicated.
Thanks for help!
- Mark as New
- Bookmark
- Subscribe
- Mute
- Subscribe to RSS Feed
- Permalink
- Report Inappropriate Content
hi again.
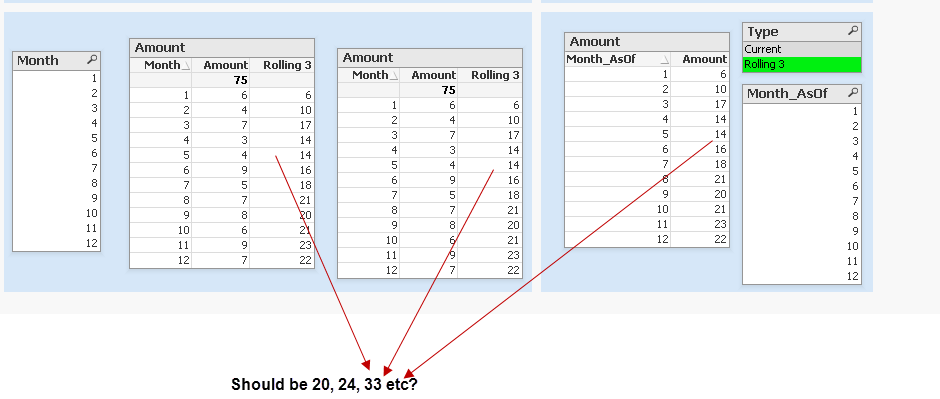
having looked through the examples and the code, I don;t think the accumulations beyond month 4 are working on any of the examples? see screenshot below from rolling 3 months.qvw
Whether this is some sort of set up issue particular to my situation I am not sure.
Also, where can I get the salestodate.xls spreadsheet referred to in the AsofTables example? or is this something we need to mock up..
- Mark as New
- Bookmark
- Subscribe
- Mute
- Subscribe to RSS Feed
- Permalink
- Report Inappropriate Content
I don;t think the accumulations beyond month 4 are working on any of the examples?
That's because the example concerns a 3-month rolling total, not an accumulate-forever-after total. The AsOf Table Examples.qvw document contains a YTD example.
The spreadsheet you asked for: salestodate.xls
talk is cheap, supply exceeds demand
- Mark as New
- Bookmark
- Subscribe
- Mute
- Subscribe to RSS Feed
- Permalink
- Report Inappropriate Content
Is this YTD Calculatios for any data..
if suppose i want my data like gross weight,net amount like this..
please sugggest me
Thanks in advance