Unlock a world of possibilities! Login now and discover the exclusive benefits awaiting you.
- Subscribe to RSS Feed
- Mark as New
- Mark as Read
- Bookmark
- Subscribe
- Printer Friendly Page
- Report Inappropriate Content
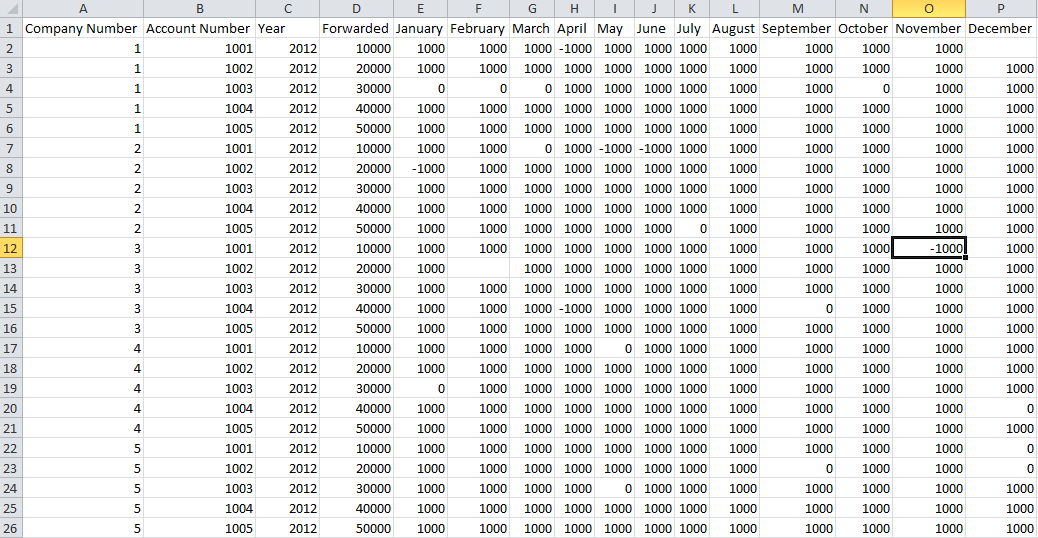
When using QlikView, sometimes we are faced with challenges such as how do we transform an Excel spreadsheet that looks like the image below into a trial balance chart that allows us to see the monthly activity for each company and account.
Well using various functions and features of QlikView such as:
• CrossTable Load of Excel spreadsheet
• IsNull() function
• RowNo() function
• Peek() function
• Date functions
• Preceding load
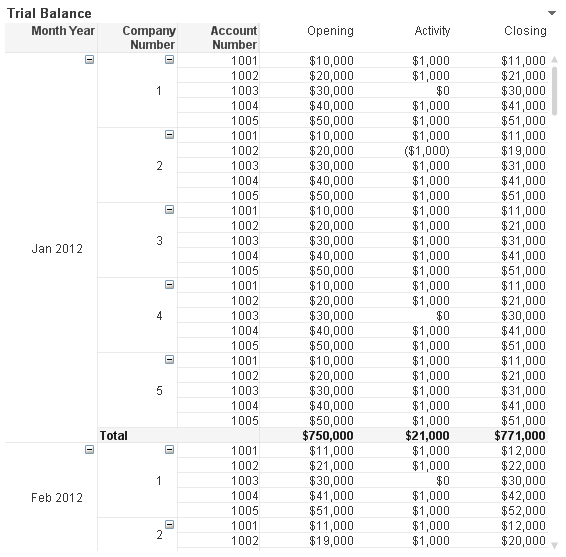
We can create a trial balance sheet that looks like this:
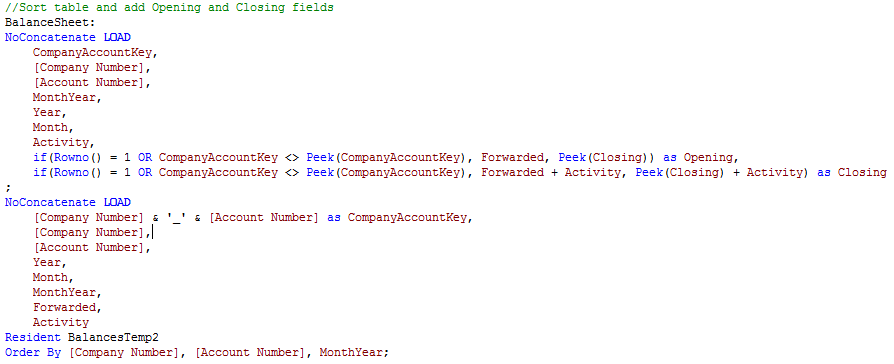
Creating this chart involves loading the Excel spreadsheet into QlikView in a format that works best for us using a CrossTable load. After sorting this data by Company Number, Account Number and Month Year, we are ready to create the Opening and Closing fields that we will need for the trial balance chart. Using the RowNo() and Peek() functions, we are able to create the opening and closing balance fields for each account number on a monthly basis allowing the user to see what the activity was like during any given month. Here is a snippet of what that script looks like:
You can view the step by step details of how the trial balance chart was created in this technical brief.
Jennell
You must be a registered user to add a comment. If you've already registered, sign in. Otherwise, register and sign in.