Unlock a world of possibilities! Login now and discover the exclusive benefits awaiting you.
Announcements
Qlik Connect 2025: 3 days of full immersion in data, analytics, and AI. May 13-15 | Orlando, FL:
Learn More
- Qlik Community
- :
- All Forums
- :
- QlikView App Dev
- :
- Re: left join and right join on graphics
Options
- Subscribe to RSS Feed
- Mark Topic as New
- Mark Topic as Read
- Float this Topic for Current User
- Bookmark
- Subscribe
- Mute
- Printer Friendly Page
Turn on suggestions
Auto-suggest helps you quickly narrow down your search results by suggesting possible matches as you type.
Showing results for
Creator
2016-03-21
06:48 AM
- Mark as New
- Bookmark
- Subscribe
- Mute
- Subscribe to RSS Feed
- Permalink
- Report Inappropriate Content
left join and right join on graphics
Goodmorning everyone
I am creating a dashboard for tracking sales.
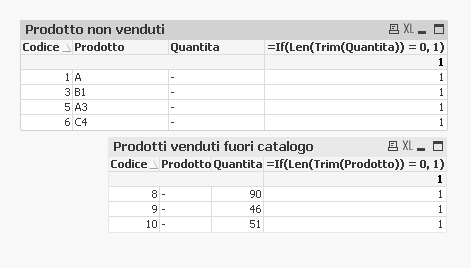
I need to have two graphs, one of the products not sold, one of the products sold out of print.
I can not identify cases of null, but always all values.
attached sample of the dashboard that I have to carry
someone would know me out?
Thank you
Andrew
807 Views
1 Solution
Accepted Solutions
Creator III
2016-03-21
07:04 AM
- Mark as New
- Bookmark
- Subscribe
- Mute
- Subscribe to RSS Feed
- Permalink
- Report Inappropriate Content
685 Views
6 Replies
MVP
2016-03-21
06:57 AM
- Mark as New
- Bookmark
- Subscribe
- Mute
- Subscribe to RSS Feed
- Permalink
- Report Inappropriate Content
Are you trying to replicate your excel result in your QlikView document?
685 Views
Creator III
2016-03-21
07:04 AM
- Mark as New
- Bookmark
- Subscribe
- Mute
- Subscribe to RSS Feed
- Permalink
- Report Inappropriate Content
Hi!
Please find the attachment !
Is it that you want?
686 Views
Creator
2016-03-21
07:11 AM
Author
- Mark as New
- Bookmark
- Subscribe
- Mute
- Subscribe to RSS Feed
- Permalink
- Report Inappropriate Content
Please find enclosed the two tables that I would get
thank you
685 Views
Creator
2016-03-21
07:12 AM
Author
- Mark as New
- Bookmark
- Subscribe
- Mute
- Subscribe to RSS Feed
- Permalink
- Report Inappropriate Content
Please find enclosed the two tables that I would get
thank you
685 Views
MVP
2016-03-21
07:17 AM
- Mark as New
- Bookmark
- Subscribe
- Mute
- Subscribe to RSS Feed
- Permalink
- Report Inappropriate Content
Check out the attached
685 Views
Creator III
2016-03-21
07:19 AM
- Mark as New
- Bookmark
- Subscribe
- Mute
- Subscribe to RSS Feed
- Permalink
- Report Inappropriate Content
in second table use expression if(isnull(Prodotto), Quantita,0)
685 Views