Unlock a world of possibilities! Login now and discover the exclusive benefits awaiting you.
- Qlik Community
- :
- All Forums
- :
- QlikView App Dev
- :
- Re: Calculating last 6 months based on selected mo...
- Subscribe to RSS Feed
- Mark Topic as New
- Mark Topic as Read
- Float this Topic for Current User
- Bookmark
- Subscribe
- Mute
- Printer Friendly Page
- Mark as New
- Bookmark
- Subscribe
- Mute
- Subscribe to RSS Feed
- Permalink
- Report Inappropriate Content
Calculating last 6 months based on selected month
Hello All,
I would like to know if it is possible to automatically calculate last 6 months based on my selected month:
For example if i choose Jan 2016

How can I get make my graph automatically to show:
janv-2016
Dec-2015
Nov-2015
Oct-2015
Sept-2015
Aug-2015
Any idea?
Many Thanks,
Hasvine
- Mark as New
- Bookmark
- Subscribe
- Mute
- Subscribe to RSS Feed
- Permalink
- Report Inappropriate Content
YOu can also check for various similar expressions from below link
Set Analysis for Rolling Periods
Regards,
Jagan.
- Mark as New
- Bookmark
- Subscribe
- Mute
- Subscribe to RSS Feed
- Permalink
- Report Inappropriate Content
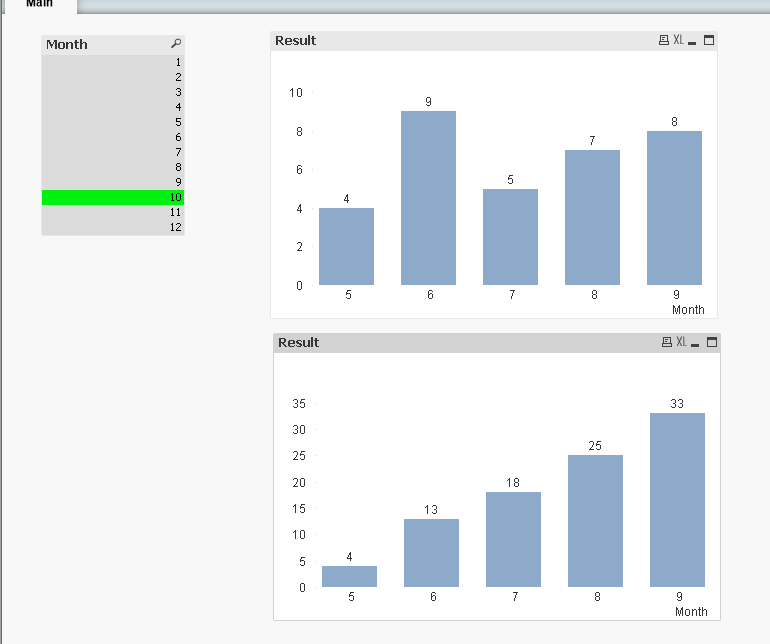
The problem is that if i choose the month 10 for example it gives me the months 5 to 12.
It does not stop at the month 10. 😞
- Mark as New
- Bookmark
- Subscribe
- Mute
- Subscribe to RSS Feed
- Permalink
- Report Inappropriate Content
See this example:
- Mark as New
- Bookmark
- Subscribe
- Mute
- Subscribe to RSS Feed
- Permalink
- Report Inappropriate Content
It doesnt help in my situation unfortunately.
Thanks,
Hasvine
- Mark as New
- Bookmark
- Subscribe
- Mute
- Subscribe to RSS Feed
- Permalink
- Report Inappropriate Content
Is this you need?
- Mark as New
- Bookmark
- Subscribe
- Mute
- Subscribe to RSS Feed
- Permalink
- Report Inappropriate Content
I would load like this to correctly handle data that spans over more than one year:
SalesData:
LOAD
Date(MakeDate(Year, Month), 'MM-YYYY') as Month,
Year*12 + Month as MonthSequence,
Year,
Amount
inline [
Year, Month, Amount
2015,8,7
2015,9,8
2015,10,6
2015,11,9
2015,12,7
2016,1,6
2016,2,4
2016,3,7
2016,4,3
2016,5,4
2016,6,9
2016,7,5
2016,8,7
2016,9,8
2016,10,6
2016,11,9
2016,12,7
];
And use the expression:
Sum({<MonthSequence = {">$(=Max(MonthSequence)-6)<=$(=Max(MonthSequence))"}, Month, Year>} Amount)
- Mark as New
- Bookmark
- Subscribe
- Mute
- Subscribe to RSS Feed
- Permalink
- Report Inappropriate Content
Sorry, if you need 6 month, change in the formula 5 for 6
- Mark as New
- Bookmark
- Subscribe
- Mute
- Subscribe to RSS Feed
- Permalink
- Report Inappropriate Content
I need the first table.
Can you please explain how you did it.
Many Thanks,
Hasvine
- Mark as New
- Bookmark
- Subscribe
- Mute
- Subscribe to RSS Feed
- Permalink
- Report Inappropriate Content
OK,
in dimension are Month and in the expression put this:
Sum({<Month={'>=$(=Max(Month)-6)<$(=Max(Month))'}>}Amount)
- Mark as New
- Bookmark
- Subscribe
- Mute
- Subscribe to RSS Feed
- Permalink
- Report Inappropriate Content
check the updated expression :
Sum({<Month={'>=$(=Max(Month)-5)<$(=Max(Month))'}>}Amount)