Unlock a world of possibilities! Login now and discover the exclusive benefits awaiting you.
- Qlik Community
- :
- All Forums
- :
- QlikView
- :
- Conditional display of text boxes based on the num...
- Subscribe to RSS Feed
- Mark Topic as New
- Mark Topic as Read
- Float this Topic for Current User
- Bookmark
- Subscribe
- Mute
- Printer Friendly Page
- Mark as New
- Bookmark
- Subscribe
- Mute
- Subscribe to RSS Feed
- Permalink
- Report Inappropriate Content
Conditional display of text boxes based on the number of years in a bar chart
Hi,
I have a bar chart displaying 3 years of data 2014,2015 and 2016. And YOY% are displayed between the bars in a text box.
Condition here is when there is data for all the 3 years then only text boxes has to be displayed.
See below screenshot
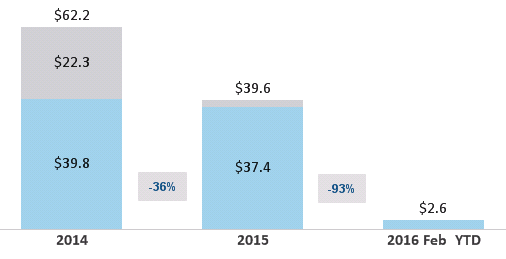
When data is there only for 1 or 2 years the text boxes should not be displayed.
To achieve this I wrote a conditional show statement under Layout 'count(DISTINCT(Year)) >2'. But this is not hiding the text boxes.
If you see in below screenshot, textboxes are overlapping with the bars.

Note: There are no year filters available in the dashboard
Can someone please help me hide these textboxes when 3 years of data is not available.
Thanks!
- « Previous Replies
- Next Replies »
Accepted Solutions
- Mark as New
- Bookmark
- Subscribe
- Mute
- Subscribe to RSS Feed
- Permalink
- Report Inappropriate Content
Can you check:
- Mark as New
- Bookmark
- Subscribe
- Mute
- Subscribe to RSS Feed
- Permalink
- Report Inappropriate Content
can you please share your sample QVW file. May be that would give us more information about the app.
- Mark as New
- Bookmark
- Subscribe
- Mute
- Subscribe to RSS Feed
- Permalink
- Report Inappropriate Content
Attached the qvw...
Please take a look.
- Mark as New
- Bookmark
- Subscribe
- Mute
- Subscribe to RSS Feed
- Permalink
- Report Inappropriate Content
Try this expression:
GetSelectedCount([Parent Firm Name]) >=1 and
Count(Aggr(if(sum({<SPENDTYPE = {'ARIBA'}>}(SPEND)/1000000)-(sum({<SPENDTYPE = {'OTHER_GL','PAYMENTS'}>}(SPEND)/1000000)) > 0,
(sum({<SPENDTYPE = {'ARIBA'}>}(SPEND)/1000000))-(sum({<SPENDTYPE = {'OTHER_GL','PAYMENTS'}>}(SPEND)/1000000))), Year)) >= 3
- Mark as New
- Bookmark
- Subscribe
- Mute
- Subscribe to RSS Feed
- Permalink
- Report Inappropriate Content
Thanks for your reply Sunny.
With the expression you gave, text box is hidden all the time irrespective of the number of years 

- Mark as New
- Bookmark
- Subscribe
- Mute
- Subscribe to RSS Feed
- Permalink
- Report Inappropriate Content
Can you share the application with the three bars? I cannot test that part because it was not available in the previous qvw file
- Mark as New
- Bookmark
- Subscribe
- Mute
- Subscribe to RSS Feed
- Permalink
- Report Inappropriate Content
Added new qvw to my original post..
I included 2 firms, one with 3 years of data and the other is with2 years.
Please take a look.
- Mark as New
- Bookmark
- Subscribe
- Mute
- Subscribe to RSS Feed
- Permalink
- Report Inappropriate Content
Give this a try:
GetSelectedCount([Parent Firm Name]) >=1 and
Count(DISTINCT Aggr(if(
RangeSum(
Sum({<[Matter #] = P(MATTER_NO), SPENDTYPE -= {'ARIBA'}>}SPEND/1000000),
Sum(OUTLOOK_SPEND/1000000),
Sum(OUTLOOK_SPEND/1000000)*12) > 0, Year), Year, CHECKDATE)) >= 3
- Mark as New
- Bookmark
- Subscribe
- Mute
- Subscribe to RSS Feed
- Permalink
- Report Inappropriate Content
Thanks much! That worked!
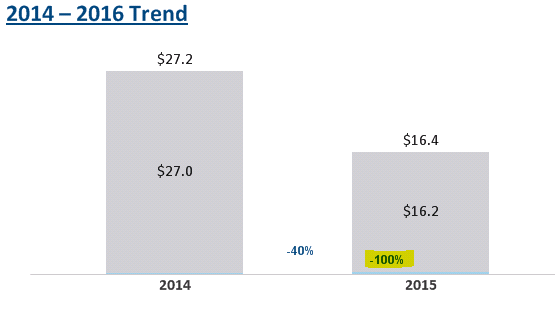
Unfortunately users changed the requirement  They want to see YOY% if there are 2 or more years in the bar chart.
example: in below screenshot they want to see YOY% between 2014 and 2015 and -100% should not be displayed; -40% which is the YOY% for 2014 and 2015 should not overlap with the bars.
Can you please help me with this. I really appreciate your help.
Thanks a lot!
- Mark as New
- Bookmark
- Subscribe
- Mute
- Subscribe to RSS Feed
- Permalink
- Report Inappropriate Content
So you need three text boxes now? 2 show up when you have 3 years and 1 show up when you have 2 years?
- « Previous Replies
- Next Replies »