Unlock a world of possibilities! Login now and discover the exclusive benefits awaiting you.
- Qlik Community
- :
- All Forums
- :
- QlikView App Dev
- :
- Re: looking for change in expression
- Subscribe to RSS Feed
- Mark Topic as New
- Mark Topic as Read
- Float this Topic for Current User
- Bookmark
- Subscribe
- Mute
- Printer Friendly Page
- Mark as New
- Bookmark
- Subscribe
- Mute
- Subscribe to RSS Feed
- Permalink
- Report Inappropriate Content
looking for change in expression
Hello
my requiremnt is to show % of each decision filed value of same supplier ,to achieve this in a bar chart
i took dimension: 1)name1 //(supplier name filed)
2)decision //(accepted,rejected,exception)
and expression i wrote is:
count({$<YEAR= , Quarter=, ENSTEHDAT={">=$(vFromdate)<=$(vTodate)"}>} PRUEFLOS)
/count({$<YEAR=,Quarter=, ENSTEHDAT={">=$(vFromdate)<=$(vTodate)"}>} Total <name1> PRUEFLOS)
so problem is while i am showing all the supplier i am getting different values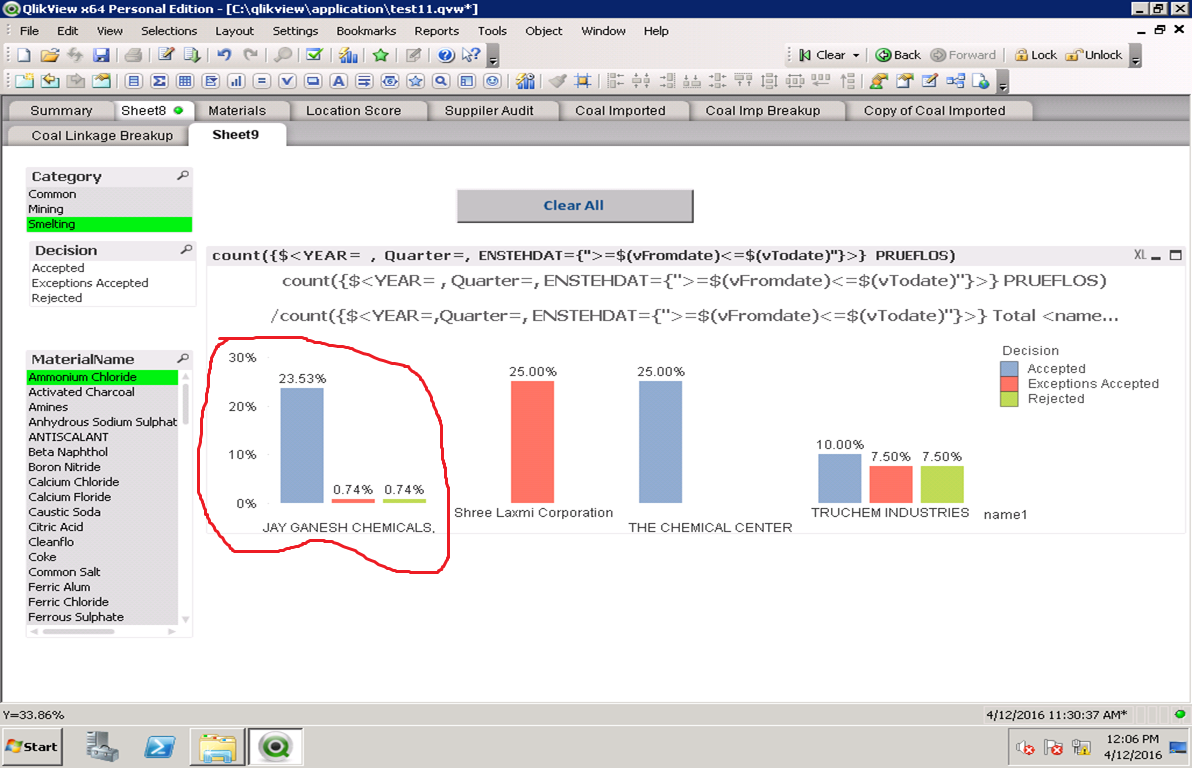
but if i choose one supplier then i am able to get what i am looking
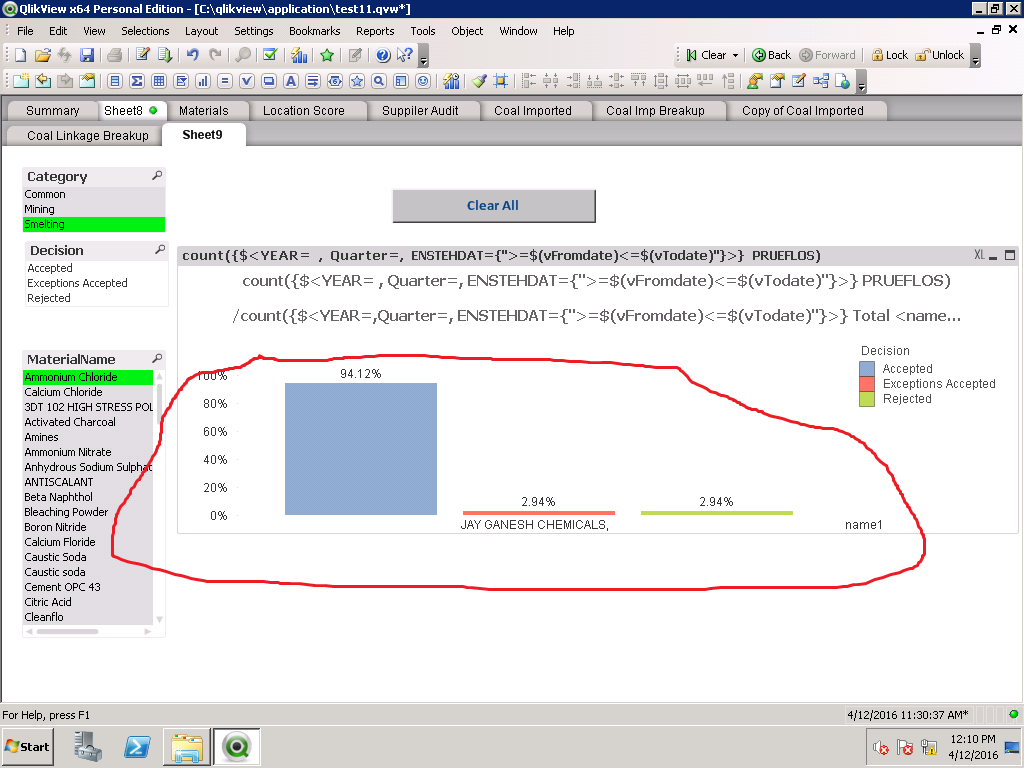
this is what i am looking ,so i think i need to do a changes in my expression ,any one suggest me what changes should i need to do plz
- Mark as New
- Bookmark
- Subscribe
- Mute
- Subscribe to RSS Feed
- Permalink
- Report Inappropriate Content
plz find my attachment
- Mark as New
- Bookmark
- Subscribe
- Mute
- Subscribe to RSS Feed
- Permalink
- Report Inappropriate Content
May be something like this
count({$<YEAR= , Quarter=, ENSTEHDAT={">=$(vFromdate)<=$(vTodate)"}>} PRUEFLOS)
/sum({$<YEAR=,Quarter=, ENSTEHDAT={">=$(vFromdate)<=$(vTodate)"}>} aggr(count({$<YEAR=,Quarter=, ENSTEHDAT={">=$(vFromdate)<=$(vTodate)"}>} PRUEFLOS),name1))
- Mark as New
- Bookmark
- Subscribe
- Mute
- Subscribe to RSS Feed
- Permalink
- Report Inappropriate Content
Not sure why, but recreating the chart works for some reason. Used the same exact expression
- Mark as New
- Bookmark
- Subscribe
- Mute
- Subscribe to RSS Feed
- Permalink
- Report Inappropriate Content
so you mean i should delete this chart and create a new one
- Mark as New
- Bookmark
- Subscribe
- Mute
- Subscribe to RSS Feed
- Permalink
- Report Inappropriate Content
Yup, that's exactly what I mean 
- Mark as New
- Bookmark
- Subscribe
- Mute
- Subscribe to RSS Feed
- Permalink
- Report Inappropriate Content
Hi naveen,
when I opened your app, I saw you marked the 'Relative' check box with your expression which is already 'relative'.
See the picture:
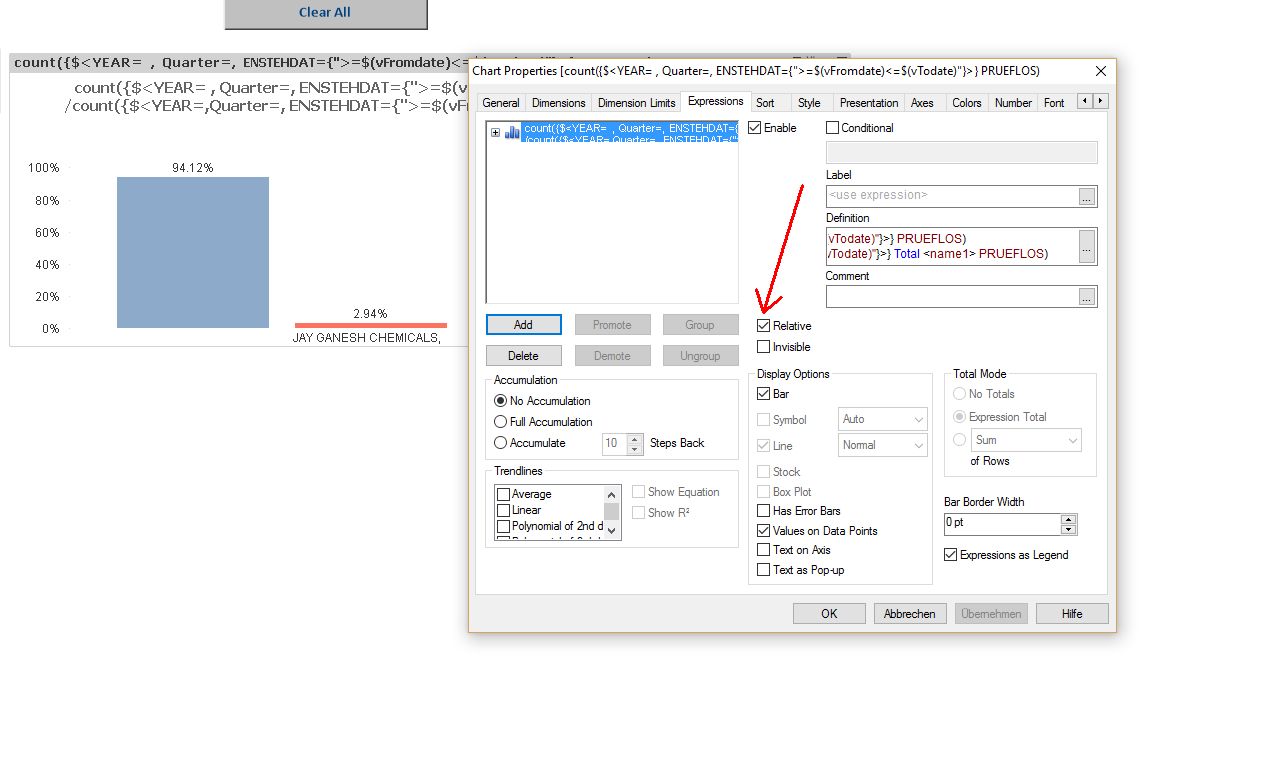
Hope this helps
Burkhard
- Mark as New
- Bookmark
- Subscribe
- Mute
- Subscribe to RSS Feed
- Permalink
- Report Inappropriate Content
Good catch, did not notice that
- Mark as New
- Bookmark
- Subscribe
- Mute
- Subscribe to RSS Feed
- Permalink
- Report Inappropriate Content
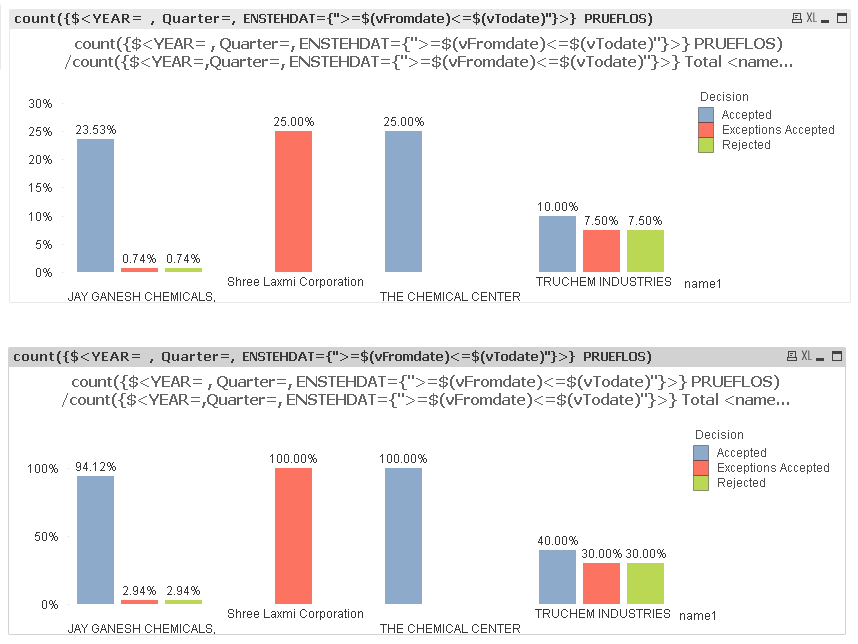
i dont known what magic have u got with you ,but its not working for me,i had recreated the chart
dimension: name1,decision
expression:
count({$<YEAR= , Quarter=, ENSTEHDAT={">=$(vFromdate)<=$(vTodate)"}>} PRUEFLOS)
/count({$<YEAR=,Quarter=, ENSTEHDAT={">=$(vFromdate)<=$(vTodate)"}>} Total <name1> PRUEFLOS)
and i getting this
- Mark as New
- Bookmark
- Subscribe
- Mute
- Subscribe to RSS Feed
- Permalink
- Report Inappropriate Content
Look at Burkhard Veidl response below
- Mark as New
- Bookmark
- Subscribe
- Mute
- Subscribe to RSS Feed
- Permalink
- Report Inappropriate Content
