Unlock a world of possibilities! Login now and discover the exclusive benefits awaiting you.
- Qlik Community
- :
- All Forums
- :
- QlikView App Dev
- :
- Re: Add count to pivot table
- Subscribe to RSS Feed
- Mark Topic as New
- Mark Topic as Read
- Float this Topic for Current User
- Bookmark
- Subscribe
- Mute
- Printer Friendly Page
- Mark as New
- Bookmark
- Subscribe
- Mute
- Subscribe to RSS Feed
- Permalink
- Report Inappropriate Content
Add count to pivot table
Hello,
I tried searching for a post in the forum that might help me but couldn't figure it out.
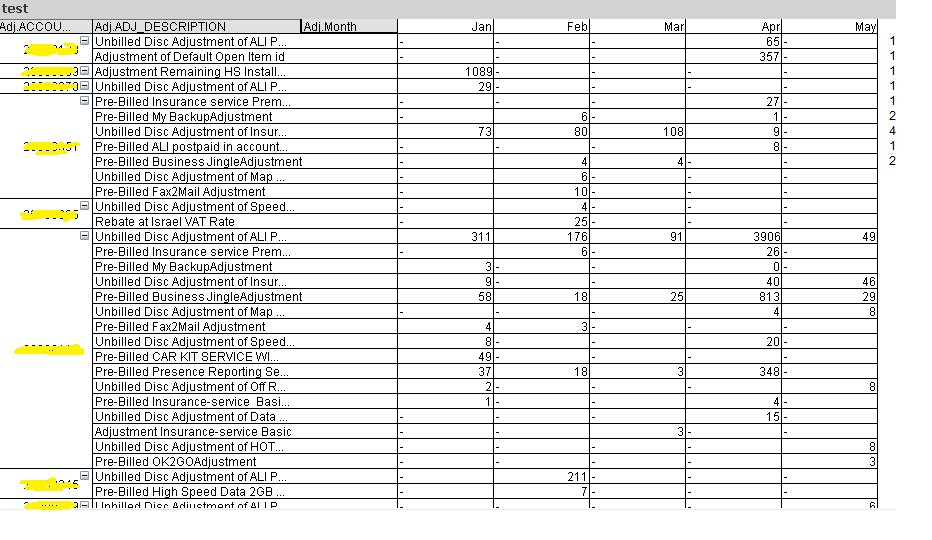
I want to create a count for my pivot table so that I can see how many refunds was given to an account for a certain reason.
For example:
I added the numbers next to each row that will count how many times adj.amount appears
Thank you for all your help
- Tags:
- qlikview_scripting
- « Previous Replies
-
- 1
- 2
- Next Replies »
- Mark as New
- Bookmark
- Subscribe
- Mute
- Subscribe to RSS Feed
- Permalink
- Report Inappropriate Content
May be we can collaborate. I will take first attempt and then you can come in to make modifications or improvements? Deal
- Mark as New
- Bookmark
- Subscribe
- Mute
- Subscribe to RSS Feed
- Permalink
- Report Inappropriate Content
hahaha ok. done
- Mark as New
- Bookmark
- Subscribe
- Mute
- Subscribe to RSS Feed
- Permalink
- Report Inappropriate Content
Hi,
Please find attached file for solution.
Script:
Table:
LOAD ACCOUNT, DESC,
Month(MONTH) AS MONTH,
VALUE
Inline [
ACCOUNT, DESC, MONTH, VALUE
A, ABC, 01/04/2016, 65
A, DEF, 01/04/2016, 357
B, GHI, 01/01/2016, 1089
C, JKL, 01/01/2016, 29
D, MNO, 01/04/2016, 27
F, PQR, 01/02/2016, 6
F, PQR, 01/02/2016, 1
F, STU, 01/01/2016, 73
F, STU, 01/02/2016, 80
F, STU, 01/03/2016, 108
F, STU, 01/04/2016, 9
];
Chart:
Dimensions: ACCOUNT, DESC, MONTH
Expression: =If(secondaryDimensionality(), Sum(VALUE), Count(Distinct MONTH))
Hope this helps you.
Regards,
Jagan.
- Mark as New
- Bookmark
- Subscribe
- Mute
- Subscribe to RSS Feed
- Permalink
- Report Inappropriate Content
Sunny,
Getting same problem, If possible can you please attach one more time...
- Mark as New
- Bookmark
- Subscribe
- Mute
- Subscribe to RSS Feed
- Permalink
- Report Inappropriate Content
Difficult to say without looking at it. Would you be able to share a sample?
- Mark as New
- Bookmark
- Subscribe
- Mute
- Subscribe to RSS Feed
- Permalink
- Report Inappropriate Content
Remove calculated dimension, apply ok. add it again. and drag it horizontal
- Mark as New
- Bookmark
- Subscribe
- Mute
- Subscribe to RSS Feed
- Permalink
- Report Inappropriate Content
Hi,
Did you checked my solution?
Regards,
Jagan.
- « Previous Replies
-
- 1
- 2
- Next Replies »