Unlock a world of possibilities! Login now and discover the exclusive benefits awaiting you.
Announcements
Qlik Connect 2025: 3 days of full immersion in data, analytics, and AI. May 13-15 | Orlando, FL:
Learn More
- Qlik Community
- :
- All Forums
- :
- QlikView App Dev
- :
- Line Chart - transported passengers
Options
- Subscribe to RSS Feed
- Mark Topic as New
- Mark Topic as Read
- Float this Topic for Current User
- Bookmark
- Subscribe
- Mute
- Printer Friendly Page
Turn on suggestions
Auto-suggest helps you quickly narrow down your search results by suggesting possible matches as you type.
Showing results for
Anonymous
Not applicable
2016-06-23
04:35 AM
- Mark as New
- Bookmark
- Subscribe
- Mute
- Subscribe to RSS Feed
- Permalink
- Report Inappropriate Content
Line Chart - transported passengers
Hello,
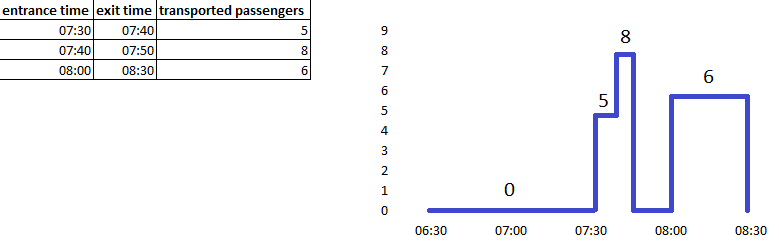
i'm trying to visualize the number of transported passengers of a bus company.
should look like the attached sketch.
I would take a line chart with expression = number of passengers
But I don't know how i can get a proper a dimension, because it consists of two time fields.
Maybe I could create time frames, like 07:00-07:10, 07:10-07:20, and so on.
Does anyone has an idea?
thanks!
297 Views
1 Reply
MVP
2016-06-23
07:16 AM
- Mark as New
- Bookmark
- Subscribe
- Mute
- Subscribe to RSS Feed
- Permalink
- Report Inappropriate Content
I think you need to match your entrance- and exit-time to a The Master Time Table per IntervalMatch and within the time-table you could create those time-frames which you need.
- Marcus
225 Views