Unlock a world of possibilities! Login now and discover the exclusive benefits awaiting you.
- Qlik Community
- :
- All Forums
- :
- QlikView
- :
- Re: Bar Chart Precissons
- Subscribe to RSS Feed
- Mark Topic as New
- Mark Topic as Read
- Float this Topic for Current User
- Bookmark
- Subscribe
- Mute
- Printer Friendly Page
- Mark as New
- Bookmark
- Subscribe
- Mute
- Subscribe to RSS Feed
- Permalink
- Report Inappropriate Content
Bar Chart Precissons
Hi Team,
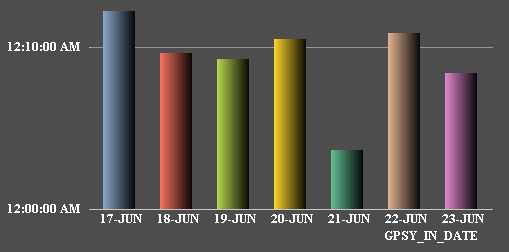
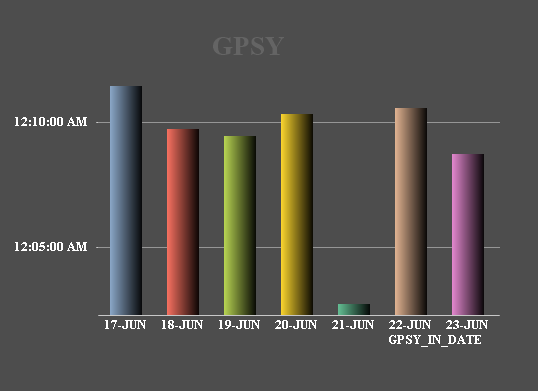
I have issue with precis sons on the Y -Axis which is time . I need the time to be plotted on Y - Axis and and the File receiving date to be plotted on X-Axis The bar should represent every day file at which time it has come ,and whether it has crossed the threshold .
I am able to plot that but the variance on the Y - Axis i am unable to adjust in difference of 10 . I want the difference to be 12:00 AM 12:10 AM rather its showing as !2:00 and 12:02 AM which is misleading and unable to get the Threshold .
I need to get the threshold line which is at 1:00 AM .
I am attaching the qvw which i made ,Kindly advise or make the setting .
Regards,
Bharat .
- Mark as New
- Bookmark
- Subscribe
- Mute
- Subscribe to RSS Feed
- Permalink
- Report Inappropriate Content
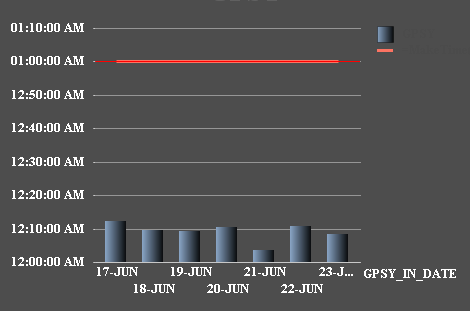
Like this?
- Mark as New
- Bookmark
- Subscribe
- Mute
- Subscribe to RSS Feed
- Permalink
- Report Inappropriate Content
Yes ,Sunny Exactly i want that ,thanks for that , and also i need to get the threshold line with is at 1:00 AM which needs to be drawn.
Kindly let me know what setting needs to be made .
- Mark as New
- Bookmark
- Subscribe
- Mute
- Subscribe to RSS Feed
- Permalink
- Report Inappropriate Content
Like this?
- Mark as New
- Bookmark
- Subscribe
- Mute
- Subscribe to RSS Feed
- Permalink
- Report Inappropriate Content
Hi Sunny ,
Exactly like that .i would like to bring the same for rest of the two graphs as well. Kindly suggest me the settings.
Thanks for that , also can u link me to a reference material which can help me more on the charts .
Appreciate your help on this .
- Mark as New
- Bookmark
- Subscribe
- Mute
- Subscribe to RSS Feed
- Permalink
- Report Inappropriate Content
Added static step on axis tab
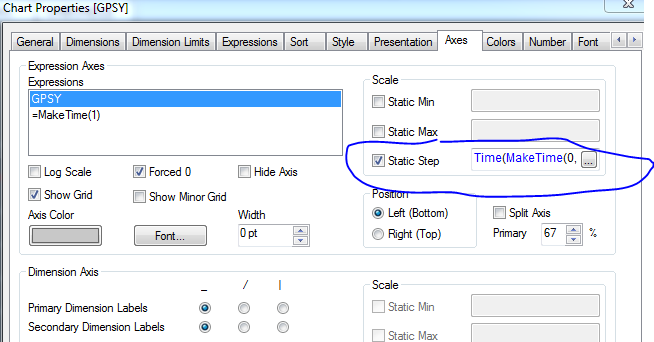
Added a second expression
MakeTime(1)
- Mark as New
- Bookmark
- Subscribe
- Mute
- Subscribe to RSS Feed
- Permalink
- Report Inappropriate Content
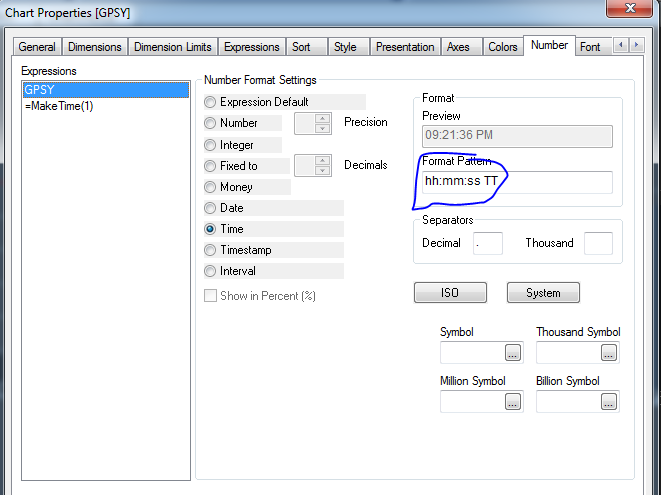
Also changed number format on the numbers tab
- Mark as New
- Bookmark
- Subscribe
- Mute
- Subscribe to RSS Feed
- Permalink
- Report Inappropriate Content
Hi Sunny ,
I tried the same which u suggested but still it shows me like this , can u please help me here or attach the QVW which u modified (or) the exact syntax which u put in the AXes and the EPRESSION TABS .
- Mark as New
- Bookmark
- Subscribe
- Mute
- Subscribe to RSS Feed
- Permalink
- Report Inappropriate Content
Open the qvw at this link: