Unlock a world of possibilities! Login now and discover the exclusive benefits awaiting you.
- Qlik Community
- :
- All Forums
- :
- QlikView App Dev
- :
- Re: Need to calculate average
- Subscribe to RSS Feed
- Mark Topic as New
- Mark Topic as Read
- Float this Topic for Current User
- Bookmark
- Subscribe
- Mute
- Printer Friendly Page
- Mark as New
- Bookmark
- Subscribe
- Mute
- Subscribe to RSS Feed
- Permalink
- Report Inappropriate Content
Need to calculate average
Hi All,
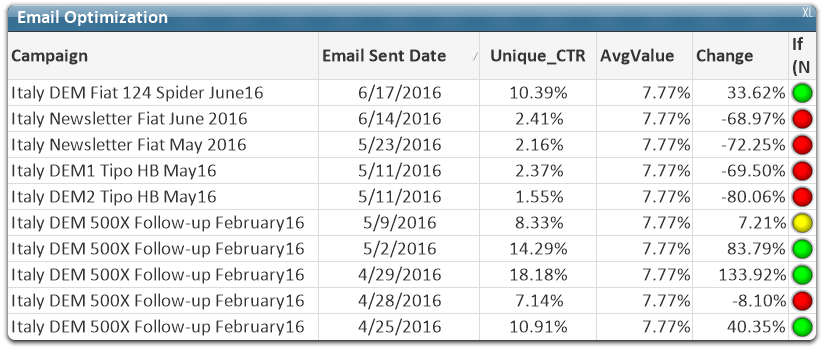
I have a straight table chart and in the presentation tab i have given max number as 10 values.
I have campaign and email send date as dimension and my expression is
sum([Unique Clickthroughs])/sum([Total Sends]).
Now by doing this i have got some values.
Now i needed an expression to calculate the avg of those 10 values.
Attached excel for reference and how i am calculating the values.
Thanks
Bharat
- Tags:
- qlikview_scripting
- Mark as New
- Bookmark
- Subscribe
- Mute
- Subscribe to RSS Feed
- Permalink
- Report Inappropriate Content
HI Greg,
Can you please tell me how can i calculate using aggr function because my requirement needs that because i have filters called market and brand..
Can you please tell me how to achieve this
- Mark as New
- Bookmark
- Subscribe
- Mute
- Subscribe to RSS Feed
- Permalink
- Report Inappropriate Content
This is not working when i select filters.
Attaching qvw pls check..
- Mark as New
- Bookmark
- Subscribe
- Mute
- Subscribe to RSS Feed
- Permalink
- Report Inappropriate Content
if you do not want filters to effect calculation you can use below expression
Num(([Unique Open Rate]-Avg({1} TOTAL [Unique Open Rate]))/Avg({1}TOTAL [Unique Open Rate]),'###.###%')
- Mark as New
- Bookmark
- Subscribe
- Mute
- Subscribe to RSS Feed
- Permalink
- Report Inappropriate Content
No No. I need filters to be effected the calculation.. The values should change based on the selection of filters.
- Mark as New
- Bookmark
- Subscribe
- Mute
- Subscribe to RSS Feed
- Permalink
- Report Inappropriate Content
This?
Expressions:
1) If(Num(Rank(TOTAL If(Sum([Unique Clickthroughs]) > 0, [Email Sent Date]), 4, 1)) <= 10, Sum([Unique Clickthroughs])/Sum([Total Sends]))
2)
If(Num(Rank(TOTAL If(Sum([Unique Clickthroughs]) > 0, [Email Sent Date]), 4, 1)) <= 10,
Avg(TOTAL Aggr(If(Num(Rank(TOTAL If(Sum([Unique Clickthroughs]) > 0, [Email Sent Date]), 4, 1)) <= 10, Sum([Unique Clickthroughs])/Sum([Total Sends])), Campaign, [Email Sent Date])))
3) =(Unique_CTR/AvgValue)-1
- Mark as New
- Bookmark
- Subscribe
- Mute
- Subscribe to RSS Feed
- Permalink
- Report Inappropriate Content
Or may be add these to make the formula even more robust
If(Num(Rank(TOTAL If(Sum([Unique Clickthroughs]) > 0 and Sum([Total Sends]) > 0, [Email Sent Date]), 4, 1)) <= 10, Sum([Unique Clickthroughs])/Sum([Total Sends]))
If(Num(Rank(TOTAL If(Sum([Unique Clickthroughs]) > 0 and Sum([Total Sends]) > 0, [Email Sent Date]), 4, 1)) <= 10,
Avg(TOTAL Aggr(If(Num(Rank(TOTAL If(Sum([Unique Clickthroughs]) > 0 and Sum([Total Sends]) > 0, [Email Sent Date]), 4, 1)) <= 10, Sum([Unique Clickthroughs])/Sum([Total Sends])), Campaign, [Email Sent Date])))
- Mark as New
- Bookmark
- Subscribe
- Mute
- Subscribe to RSS Feed
- Permalink
- Report Inappropriate Content
Awesome Sunny. Exactly What i needed.. I don't know for me why this is this much complex and for you its matter of secs.
Now the only thing i need is
for this expression if the value is less than 10(Unique_CTR/AvgValue)-1 percent means i need do display redimage 'qmem://<bundled>/BuiltIn/led_r.png' and more than 10 percent means green and in between means yellow.
Can you please help me how can i achieve this..
- Mark as New
- Bookmark
- Subscribe
- Mute
- Subscribe to RSS Feed
- Permalink
- Report Inappropriate Content
What comes in between less than 10 and more than 10? Yellow = 10%
- Mark as New
- Bookmark
- Subscribe
- Mute
- Subscribe to RSS Feed
- Permalink
- Report Inappropriate Content
If the percentage vale is less than -10 percent means red indicator, if the value is +10 means green in between -10 and +10 is yellow.. Sorry i forget to mention -10
- Mark as New
- Bookmark
- Subscribe
- Mute
- Subscribe to RSS Feed
- Permalink
- Report Inappropriate Content
I changed the conditons slightly, but can you modify them based on your requirement.
< 0, Red
< 10%, Yellow
> 10%, Red
If(Num(Rank(TOTAL If(Sum([Unique Clickthroughs]) > 0 and Sum([Total Sends]) > 0, [Email Sent Date]), 4, 1)) <= 10,
If(Change <= 0, 'qmem://<bundled>/BuiltIn/led_r.png',
If(Change <= 0.10, 'qmem://<bundled>/BuiltIn/led_y.png', 'qmem://<bundled>/BuiltIn/led_g.png')))