Unlock a world of possibilities! Login now and discover the exclusive benefits awaiting you.
- Qlik Community
- :
- All Forums
- :
- QlikView App Dev
- :
- Re: Scatter Plot Bubble Size
- Subscribe to RSS Feed
- Mark Topic as New
- Mark Topic as Read
- Float this Topic for Current User
- Bookmark
- Subscribe
- Mute
- Printer Friendly Page
- Mark as New
- Bookmark
- Subscribe
- Mute
- Subscribe to RSS Feed
- Permalink
- Report Inappropriate Content
Scatter Plot Bubble Size
Background:
We issue recommendations to our clients and we track how long it takes them to rectify the issue (Months Outstanding) and how many times they change the target date to close out the recommendation (# of times revised). Based on those two factors (expressions) I have created a scatterplot chart with a dimension of Recommendation ID. It works perfect, I even define the color of the bubbles based on a formula to express criticality.
Question:
The only issue is that I can have multiple recommendation ids that have the same Months outstanding and # of times revised and I want to make the bubble larger based on how many recommendations have the same combinations of Months outstanding and # of times revised.
Any help you could provide would be greatly appreciated,
Chad
- Mark as New
- Bookmark
- Subscribe
- Mute
- Subscribe to RSS Feed
- Permalink
- Report Inappropriate Content
I am not sure if I understand your thread, can you please share your sample qvw
- Mark as New
- Bookmark
- Subscribe
- Mute
- Subscribe to RSS Feed
- Permalink
- Report Inappropriate Content
Anil Babu wrote:
I am not sure if I understand your thread, can you please share your sample qvw
Please see attached.
- Mark as New
- Bookmark
- Subscribe
- Mute
- Subscribe to RSS Feed
- Permalink
- Report Inappropriate Content
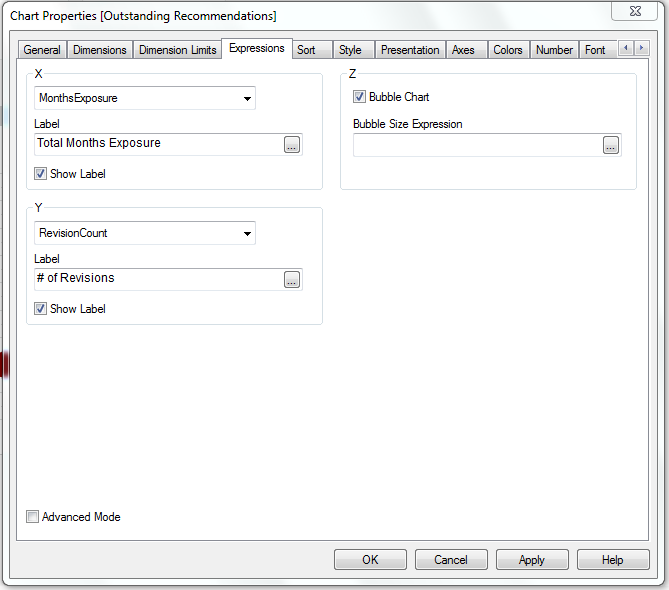
YOu can increase the bubble size here: Just click on Advanced mode in expression tab on bottom left corner you can see this window and give your expression.
- Mark as New
- Bookmark
- Subscribe
- Mute
- Subscribe to RSS Feed
- Permalink
- Report Inappropriate Content
I am aware that I can change the size using the Bubble size expression but I don't know what expression to use to get the results I need. I want the bubble to increase in size based on the total number of recommendations that have the same 'Total Months Exposure" and '# of Revisions' . The table below would produce 3 bubbles on the chart I want ID 6 to be the smallest bubble, ID 1 & 2 a little bigger and ID 3,4 & 5 the biggest.
| Recommendation ID | Total Months Exposure | # of Times Revised |
| 1 | 20 | 2 |
| 2 | 20 | 2 |
| 3 | 18 | 3 |
| 4 | 18 | 3 |
| 5 | 18 | 3 |
| 6 | 5 | 0 |
- Mark as New
- Bookmark
- Subscribe
- Mute
- Subscribe to RSS Feed
- Permalink
- Report Inappropriate Content
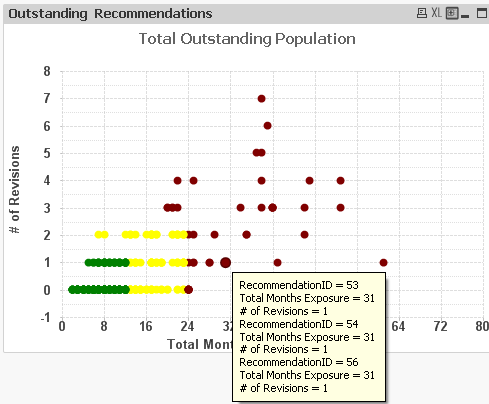
Just to be more clear I want the highlighted bubble on the picture below to have a larger bubble because three different recommendations ids have the exact same months outstanding and times revised. See below:
- Mark as New
- Bookmark
- Subscribe
- Mute
- Subscribe to RSS Feed
- Permalink
- Report Inappropriate Content
Did you try putting in RecommendationID in the bubble size expression and check ?
= RecommendationID
- Mark as New
- Bookmark
- Subscribe
- Mute
- Subscribe to RSS Feed
- Permalink
- Report Inappropriate Content
Or use = Avg(BubbleSize)
- Mark as New
- Bookmark
- Subscribe
- Mute
- Subscribe to RSS Feed
- Permalink
- Report Inappropriate Content
Yes, that just increases the bubble size based on the ID number. In the example above, I would like the bubble to count 3 observations and then increase size accordingly compared to another bubble that only has one observation.
- Mark as New
- Bookmark
- Subscribe
- Mute
- Subscribe to RSS Feed
- Permalink
- Report Inappropriate Content
Try this and see.
= Avg(Aggr(MonthsExposure, RecommendationID))