Unlock a world of possibilities! Login now and discover the exclusive benefits awaiting you.
- Qlik Community
- :
- All Forums
- :
- QlikView App Dev
- :
- Re: How do I aggregate data from Dimension 2 for D...
- Subscribe to RSS Feed
- Mark Topic as New
- Mark Topic as Read
- Float this Topic for Current User
- Bookmark
- Subscribe
- Mute
- Printer Friendly Page
- Mark as New
- Bookmark
- Subscribe
- Mute
- Subscribe to RSS Feed
- Permalink
- Report Inappropriate Content
How do I aggregate data from Dimension 2 for Dimension 1?
Greetings,
I really did not know what to call this, so I will give you my scenario and hope that someone has accomplished this already
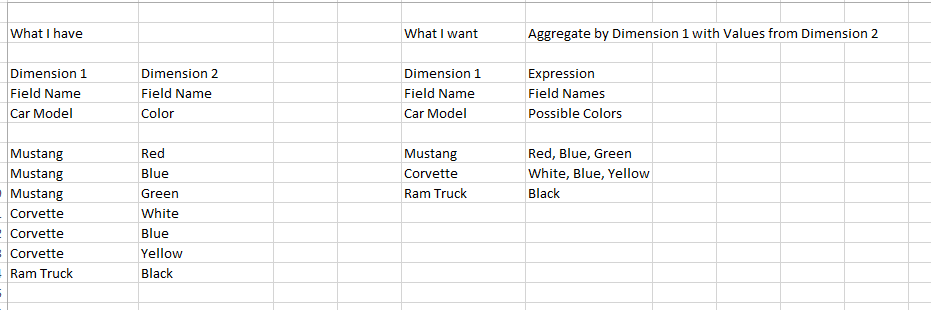
I have a dimension that has 500 values. In my example it is model of cars. Each car can have multiple colors. Dimension 2 is the color. My goal is to create a straight table where I can aggregate the possible colors for each model into one cell. It is possible for there to be 10 red mustangs, so I would only want red listed once in the Aggregation expression. Optimally the values in the expression are separate by commas, but any other delimiter is fine. There is a unique field that has a ID number for each car, but I will not use that in the chart, so there are not really duplicate records in the table of data.
Unfortunately, I can not share my actual data, but if you can solve this problem, I can apply it to my data model.
Accepted Solutions
- Mark as New
- Bookmark
- Subscribe
- Mute
- Subscribe to RSS Feed
- Permalink
- Report Inappropriate Content
Try creating a straight table chart with dimension [Car Model] and expression
=Concat(DISTINCT [Color], ', ')
- Mark as New
- Bookmark
- Subscribe
- Mute
- Subscribe to RSS Feed
- Permalink
- Report Inappropriate Content
Try creating a straight table chart with dimension [Car Model] and expression
=Concat(DISTINCT [Color], ', ')
- Mark as New
- Bookmark
- Subscribe
- Mute
- Subscribe to RSS Feed
- Permalink
- Report Inappropriate Content
Thanks for your quick response on a Sunday!
That works great except that it puts a comma after the last value
Red, Blue, Green,
The simple solution is to change the delimiter to a space, but is there a way to tell it to only put the delimiter between the values and not after the last possible one?
Red, Green, Blue
- Mark as New
- Bookmark
- Subscribe
- Mute
- Subscribe to RSS Feed
- Permalink
- Report Inappropriate Content
It shouldn't work like this, there should not be an extra delimiter after the last value.
Could you post your exact expression you are using?
- Mark as New
- Bookmark
- Subscribe
- Mute
- Subscribe to RSS Feed
- Permalink
- Report Inappropriate Content
Stefan,
You are correct, I had an '&' between the dimension and the delimiter, so it was adding the delimiter each time. It was left over from my previous efforts and I had not removed it. When I use your exact syntax, I do get the desired results. I went ahead and added a space after the comma in the delimiter ', ' so that I could read the results easier. I do appreciate your assistance!