Unlock a world of possibilities! Login now and discover the exclusive benefits awaiting you.
- Qlik Community
- :
- All Forums
- :
- QlikView App Dev
- :
- Re: Aligning Values on Data Points
- Subscribe to RSS Feed
- Mark Topic as New
- Mark Topic as Read
- Float this Topic for Current User
- Bookmark
- Subscribe
- Mute
- Printer Friendly Page
- Mark as New
- Bookmark
- Subscribe
- Mute
- Subscribe to RSS Feed
- Permalink
- Report Inappropriate Content
Aligning Values on Data Points
How do I left align my Values on Data Points?
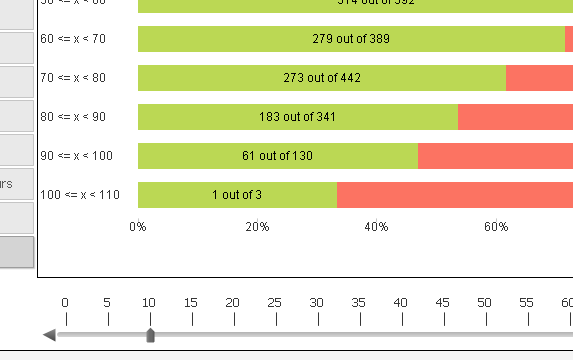
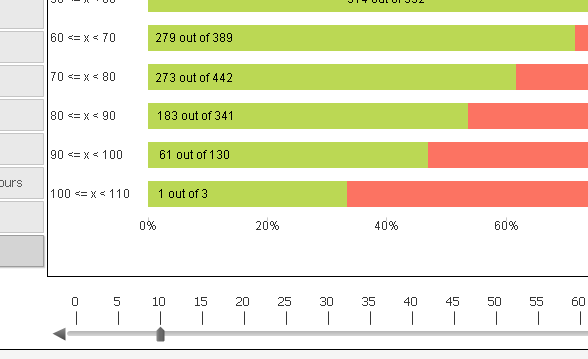
I have a bar chart, orientation = horizontal, stacked (see image below).
My Dimension uses the Class function to apply a grouping, end user can vary the size of the group via slider.
I have three Expressions:
- Percentage on Target (green)
- Percentage not on Target (pink)
- Text to show actual numbers rather than percentage (Values on Data Points is ticked only, not Bar)
In the Presentation tab I have ticked "Plot Values Inside Segments"
How do I left align the Values on Data Points? They are centred horizontally within the bar and I would like them left aligned.
Thank you.
| Image |
|---|
 |
- Mark as New
- Bookmark
- Subscribe
- Mute
- Subscribe to RSS Feed
- Permalink
- Report Inappropriate Content
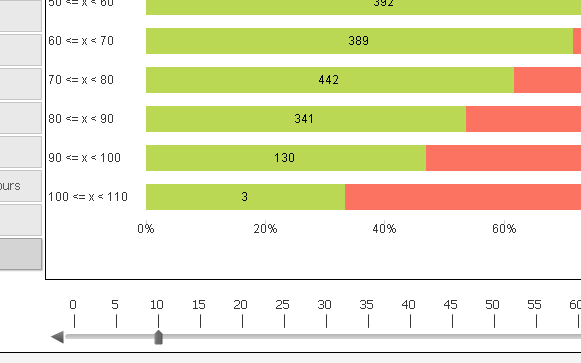
May be you can try with Dual function in your expression. Like
=dual(sum(Value)&Repeat(chr(8203),10),sum(Value))
- Mark as New
- Bookmark
- Subscribe
- Mute
- Subscribe to RSS Feed
- Permalink
- Report Inappropriate Content
Thank you for your reply.
I couldn't see how your suggestion would help but I tried it anyway. Here is the result.
| Image 1 |
|---|
|
What I am looking for is a way to align the data values to the left, like in the image below (I have used an image editor to move the text here).
| Image 2 |
|---|
 |
- Mark as New
- Bookmark
- Subscribe
- Mute
- Subscribe to RSS Feed
- Permalink
- Report Inappropriate Content
We don't have the direct option to do that. We need to add some invisible space (chr(8203)) to look like a left aligned.
for e.g you can see with the below expression
=dual(sum(Value)&Repeat('A',10),sum(Value))
the result will show with 10 'A' s.
- Mark as New
- Bookmark
- Subscribe
- Mute
- Subscribe to RSS Feed
- Permalink
- Report Inappropriate Content
I understand what your expression does but it does not solve my problem, sorry.
Thank you for trying though.
- Mark as New
- Bookmark
- Subscribe
- Mute
- Subscribe to RSS Feed
- Permalink
- Report Inappropriate Content
I'm facing the same issue in some of my applications and couldn't find a working solution so far. Anyone any idea? Thanks in advance. 