Unlock a world of possibilities! Login now and discover the exclusive benefits awaiting you.
- Qlik Community
- :
- All Forums
- :
- QlikView App Dev
- :
- Re: Obtain field with maximum value
- Subscribe to RSS Feed
- Mark Topic as New
- Mark Topic as Read
- Float this Topic for Current User
- Bookmark
- Subscribe
- Mute
- Printer Friendly Page
- Mark as New
- Bookmark
- Subscribe
- Mute
- Subscribe to RSS Feed
- Permalink
- Report Inappropriate Content
Obtain field with maximum value
Please consider the following example:
| Category | Value |
|---|---|
| A | 10% |
| B | 20% |
| B | 22% |
| A | 20% |
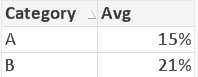
I will be loading the above table directly into Qlik. What I want is to first have an average of Value so that the following table is obtained:
| Category | Value |
|---|---|
| A | 15% |
| B | 21% |
from this now I have to find the name of the category having the highest value. So, from table1 I have to obtain Category B as the answer.
How to perform the above using Set Analysis or/and Back-end scripting?
Accepted Solutions
- Mark as New
- Bookmark
- Subscribe
- Mute
- Subscribe to RSS Feed
- Permalink
- Report Inappropriate Content
hi
for finding the Category with the highest avg
use this expression :
=FirstSortedValue(Category,-aggr(avg(Value),Category))
- Mark as New
- Bookmark
- Subscribe
- Mute
- Subscribe to RSS Feed
- Permalink
- Report Inappropriate Content
hi
for finding the Category with the highest avg
use this expression :
=FirstSortedValue(Category,-aggr(avg(Value),Category))
- Mark as New
- Bookmark
- Subscribe
- Mute
- Subscribe to RSS Feed
- Permalink
- Report Inappropriate Content
Why can't you create Simple
Num(Avg(Value),'##,##0%')
For second one try like below
For Max =FirstSortedValue(Category,Aggr(Num(Avg(Value),'##,##0%'),Category))
For Min =FirstSortedValue(Category,-Aggr(Num(Avg(Value),'##,##0%'),Category))
- Mark as New
- Bookmark
- Subscribe
- Mute
- Subscribe to RSS Feed
- Permalink
- Report Inappropriate Content
Hi,
Check this
=Num(rangeavg(Aggr(Above(sum(Value),0,rowno()),Category))/Count(Category),'#,##0%')
As Exression in chart or Table.
-Hirish
“Aspire to Inspire before we Expire!”
- Mark as New
- Bookmark
- Subscribe
- Mute
- Subscribe to RSS Feed
- Permalink
- Report Inappropriate Content
=FirstSortedValue(Distinct Category,-Aggr(Avg(Value),Category))
or
=FirstSortedValue(Category,-Aggr(Avg(Value),Category))
and if you have more than one category having same average.. you can use below to get more than one category..
=Concat({<Category = {"=Rank(Avg(Value))=1"}>}DISTINCT Category)
- Mark as New
- Bookmark
- Subscribe
- Mute
- Subscribe to RSS Feed
- Permalink
- Report Inappropriate Content
Hi Arpit,
I tried this,Its working fine.
=FirstSortedValue({<Category>}Category,-Aggr(max({<Category>}Value),Category))
By using this you can achieve Category B as the answer even if you made the selection on Category it won't change.
--Surendra
- Mark as New
- Bookmark
- Subscribe
- Mute
- Subscribe to RSS Feed
- Permalink
- Report Inappropriate Content
Thank you everyone for the help!