Unlock a world of possibilities! Login now and discover the exclusive benefits awaiting you.
- Qlik Community
- :
- All Forums
- :
- QlikView App Dev
- :
- Re: Is stacking expression into defined columns po...
- Subscribe to RSS Feed
- Mark Topic as New
- Mark Topic as Read
- Float this Topic for Current User
- Bookmark
- Subscribe
- Mute
- Printer Friendly Page
- Mark as New
- Bookmark
- Subscribe
- Mute
- Subscribe to RSS Feed
- Permalink
- Report Inappropriate Content
Is stacking expression into defined columns possible with Pivot
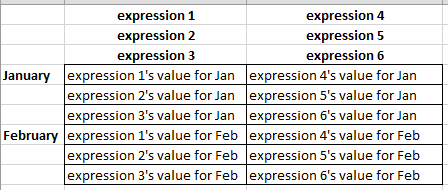
Is it possible to stack several expression into defined columns in a pivot table, like this, and if so how? Or is there another way to achieve this very unique look. I would be looking to do a month dimension down the left and then creating a column for a set of 3 expressions, so for example if I have 12 expressions to show, I would want to create 4 columns (each with 3 expressions in them). (The expressions will be using set analysis, so I don't think creating a table in script is an option.)
Thanks.
Accepted Solutions
- Mark as New
- Bookmark
- Subscribe
- Mute
- Subscribe to RSS Feed
- Permalink
- Report Inappropriate Content
Like this?
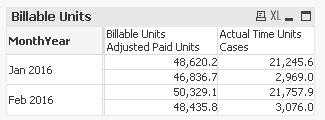
Used a one time macro to hide the second dimension
- Mark as New
- Bookmark
- Subscribe
- Mute
- Subscribe to RSS Feed
- Permalink
- Report Inappropriate Content
Would you be able to share some sample data and the output you expect to see from it?
- Mark as New
- Bookmark
- Subscribe
- Mute
- Subscribe to RSS Feed
- Permalink
- Report Inappropriate Content
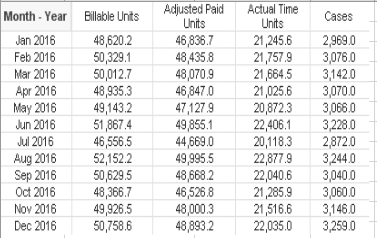
This first image is of a simple pivot table in QlikView...a 1 dimension and 4 expression example.
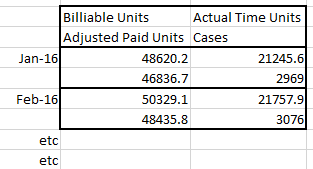
The second image is the layout being asked of me (just showing the first 2 months of course), which I have never seen done in QlikView before and am wondering if it is possible somehow. Thanks.
- Mark as New
- Bookmark
- Subscribe
- Mute
- Subscribe to RSS Feed
- Permalink
- Report Inappropriate Content
- Mark as New
- Bookmark
- Subscribe
- Mute
- Subscribe to RSS Feed
- Permalink
- Report Inappropriate Content
Thanks you for this; very helpful.