Unlock a world of possibilities! Login now and discover the exclusive benefits awaiting you.
- Qlik Community
- :
- All Forums
- :
- QlikView App Dev
- :
- Re: Hiding values in chart
- Subscribe to RSS Feed
- Mark Topic as New
- Mark Topic as Read
- Float this Topic for Current User
- Bookmark
- Subscribe
- Mute
- Printer Friendly Page
- Mark as New
- Bookmark
- Subscribe
- Mute
- Subscribe to RSS Feed
- Permalink
- Report Inappropriate Content
Hiding values in chart
Hi, I am trying to hide some values within a straight table.
I have 2 straight tables:
Goods Received
Goods Returned
Goods receiving figures are all POSITIVE values and goods returned are all NEGATIVE values.
The problem i have is that the only way i can tell what is returned and what is received is by looking at the values.
I want to be able to show ONLY POSITIVE vales in the goods received table and ONLY NEGATIVE values in the goods returned table.
I have tried writing a simple expression for each table
i.e.
If(sum(StockQty)>0,StockQty)
StockQty is my value field.
But this still shows the details for the negative lines (but hides the actual value) is there a way i can completely hide the full line for negative values on Goods Receiving and hide the complete line for positive vales on the Goods Returned table?
I have attached a sample
Thanks for your help.
Chris
Accepted Solutions
- Mark as New
- Bookmark
- Subscribe
- Mute
- Subscribe to RSS Feed
- Permalink
- Report Inappropriate Content
Chris
Change the first expression in Goods Received to =Sum(If(StockQty > 0, StockQty)). Then filter the remaining expressions using =If(Column(1) <> 0, origExpression)). The row will only be suppressed if all the expressions return zero or null.
I have done this for the Goods Received table in your sample (attached).
Hope that helps
Jonathan
- Mark as New
- Bookmark
- Subscribe
- Mute
- Subscribe to RSS Feed
- Permalink
- Report Inappropriate Content
Hi Jonathan,
Sorry, even though the negative lines are hidden, the sum expressions are still adding the negative values to the totals.
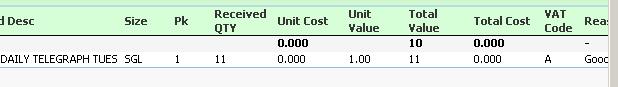
Above the [otal value] is 10 even though the line sais 11. It has added in the -1 line also.
- Mark as New
- Bookmark
- Subscribe
- Mute
- Subscribe to RSS Feed
- Permalink
- Report Inappropriate Content
Hi,
Here is your solution.
Regards,
Kaushik Solanki
- Mark as New
- Bookmark
- Subscribe
- Mute
- Subscribe to RSS Feed
- Permalink
- Report Inappropriate Content
Chris
Try changing the totals to Sum of Rows on the expression tab
Regards
Jonathan