Unlock a world of possibilities! Login now and discover the exclusive benefits awaiting you.
- Qlik Community
- :
- All Forums
- :
- QlikView App Dev
- :
- Re: Counting the Number of Negatives in a Table
- Subscribe to RSS Feed
- Mark Topic as New
- Mark Topic as Read
- Float this Topic for Current User
- Bookmark
- Subscribe
- Mute
- Printer Friendly Page
- Mark as New
- Bookmark
- Subscribe
- Mute
- Subscribe to RSS Feed
- Permalink
- Report Inappropriate Content
Counting the Number of Negatives in a Table
Good Morning \ Good Afternoon \ Good Evening
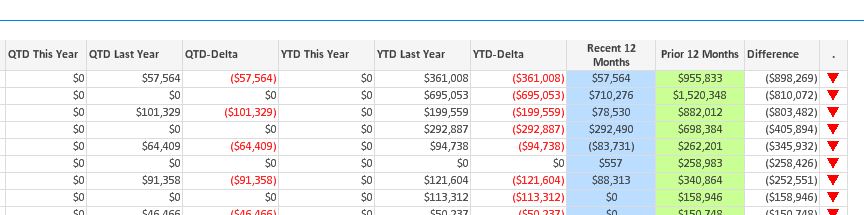
I have a scenario where I have a table containing this year vs last year sales and I want to be able to count the number of negatives and positive values. So that we can say something like we have 75 growths vs 25 contractions.
I want to be able to present this at a aggregate level instead of line by line detail.
In excel it would be a countif() statement on a range of a cells, but I am struggling to figure out the same in Qlikview.
Any ideas of how to accomplish ?
The Table which I want to reference looks like the below
Thanks for any help.
Accepted Solutions
- Mark as New
- Bookmark
- Subscribe
- Mute
- Subscribe to RSS Feed
- Permalink
- Report Inappropriate Content
Have a look at advanced Aggregation function Aggr(), something like
=-1* Sum( Aggr( ExprThisYearSales > ExprLastYearSales , AllYourChartDimensions))
- Mark as New
- Bookmark
- Subscribe
- Mute
- Subscribe to RSS Feed
- Permalink
- Report Inappropriate Content
Have a look at advanced Aggregation function Aggr(), something like
=-1* Sum( Aggr( ExprThisYearSales > ExprLastYearSales , AllYourChartDimensions))
- Mark as New
- Bookmark
- Subscribe
- Mute
- Subscribe to RSS Feed
- Permalink
- Report Inappropriate Content
- Mark as New
- Bookmark
- Subscribe
- Mute
- Subscribe to RSS Feed
- Permalink
- Report Inappropriate Content
Thanks Stefan,
The Aggregate Function is something I need to play some more with but this works really well.