Unlock a world of possibilities! Login now and discover the exclusive benefits awaiting you.
- Qlik Community
- :
- Forums
- :
- Analytics
- :
- App Development
- :
- Re: Qlik Sense Accumulating Bar Charts, Waterfall ...
- Subscribe to RSS Feed
- Mark Topic as New
- Mark Topic as Read
- Float this Topic for Current User
- Bookmark
- Subscribe
- Mute
- Printer Friendly Page
- Mark as New
- Bookmark
- Subscribe
- Mute
- Subscribe to RSS Feed
- Permalink
- Report Inappropriate Content
Qlik Sense Accumulating Bar Charts, Waterfall Chart - How To
Accumulating Chart (1 dimension, 1 measure)
While I suspect, that in later versions of Qlik Sense there should be more elegant way with a simple click to set charts to accumulate a sequence of bars (the new value totalling up to the previous values), here is an attached app that allows you all of that, illustrated and explained:
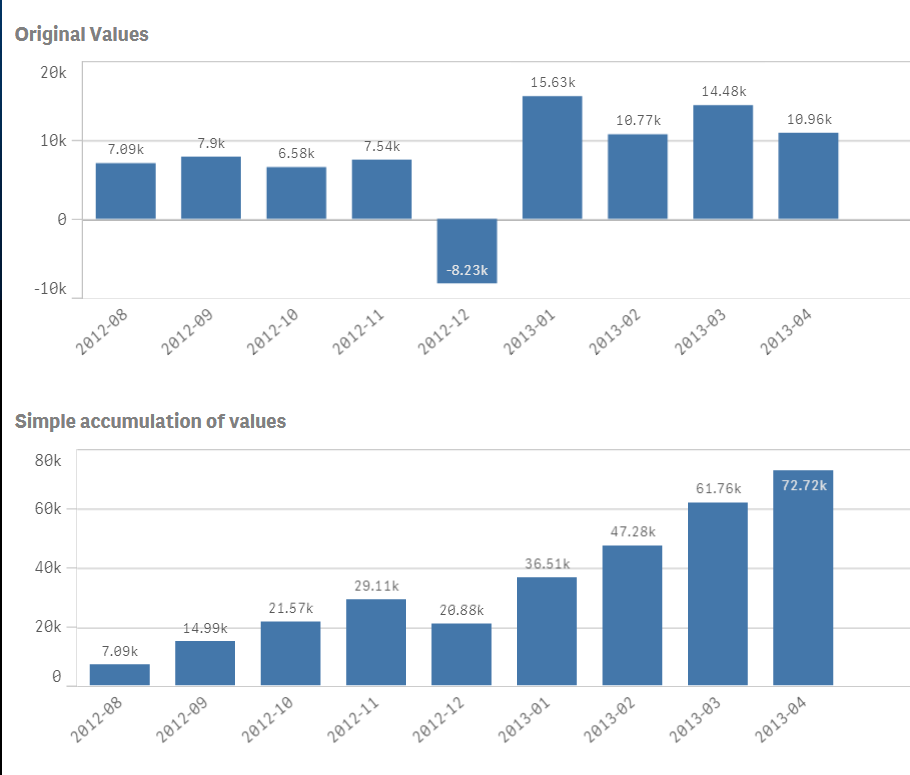
To do this you should embrace the so-called intra-chart functions. You need "Above()" and "RowNo()" in this case.
Above with only one argument delivers the result of the "above" dimension, but with a 2nd and 3rd argument will deliver an array of values, so you need another function around to sum this array into one value: RangeSum() ... not Sum() !
RangeSum(Above( sum(ExpenseActual),0,RowNo())) // Where Sum(ExpenseActual) stands for your measure formula
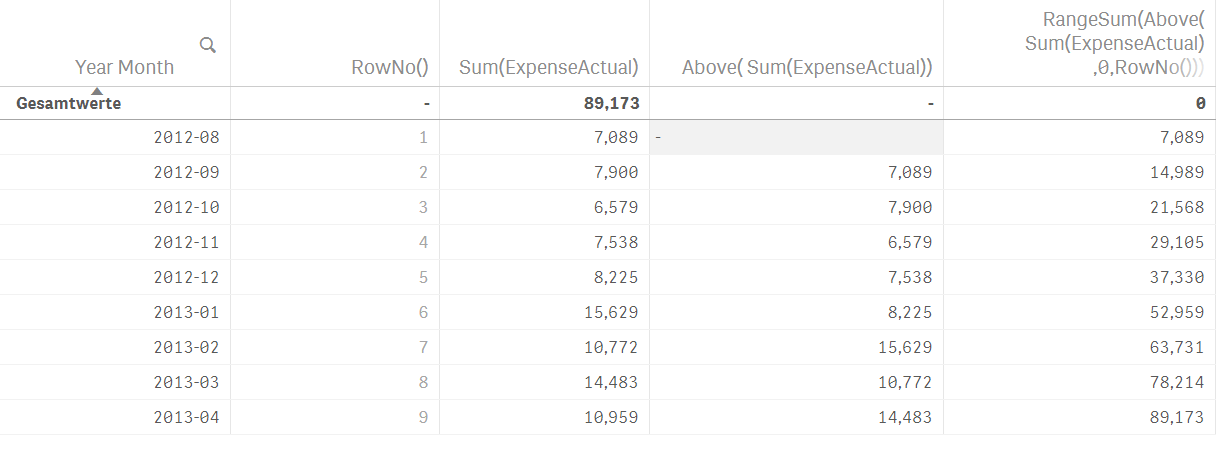
This table shows what's happening in the different parts of the formula
Accumulating Chart (2 dimensions, 1 measure)
This case is a bit more complex. Two dimensions should accumulate, each of which separately - of course. So the cumulation is calculated for each member of the 2nd dimension separately. (Visually this only makes sense with grouped bars, not with stacked bars).
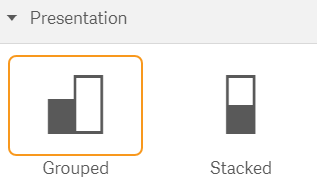
Also, this is possible, the formula is more complex to explain.
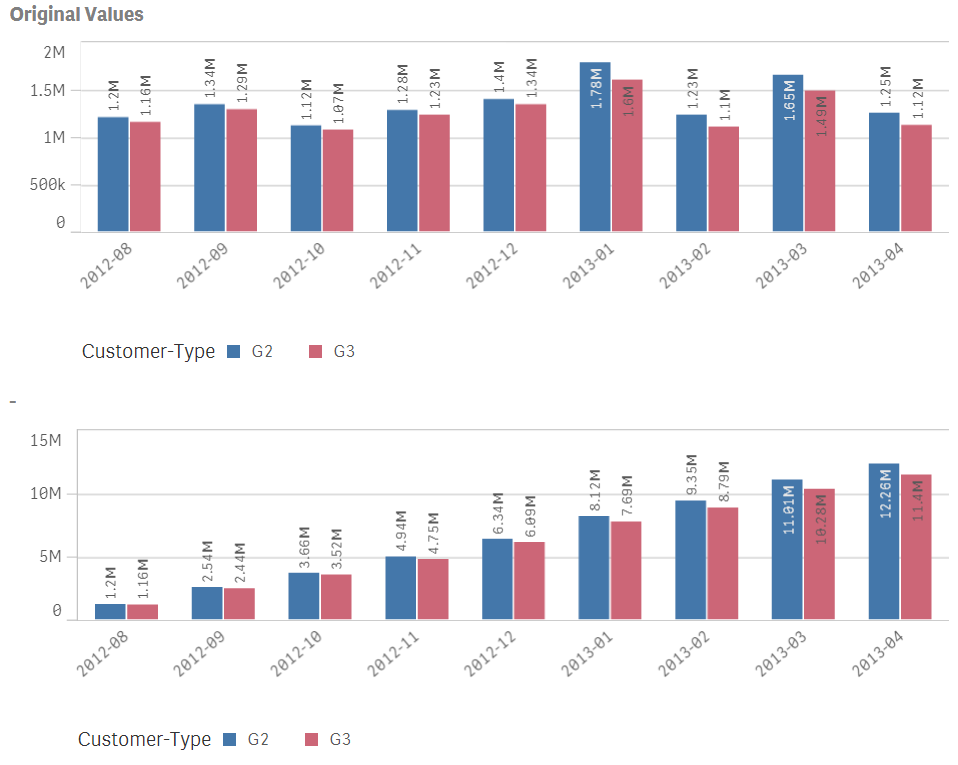
What you can see is that Customers of Type G3 had less accumulated Expenses than G2, which is impossible to see from the above bar chart.
The chart has two dimensions, one measure - here Sum(ExpenseActual), but the measure-formula has to be extended like this
$(=Concat(DISTINCT 'IF([$(=GetObjectField(1))] = ' & CHR(39) & [$(=GetObjectField(1))] & CHR(39)
& ', RangeSum(Above(TOTAL
sum(ExpenseActual)
*-([$(=GetObjectField(1))] = ' & CHR(39) & [$(=GetObjectField(1))] & CHR(39) & '), 0, RowNo(TOTAL)))'
, ',') & Repeat(')', Count(DISTINCT [$(=GetObjectField(1))])))
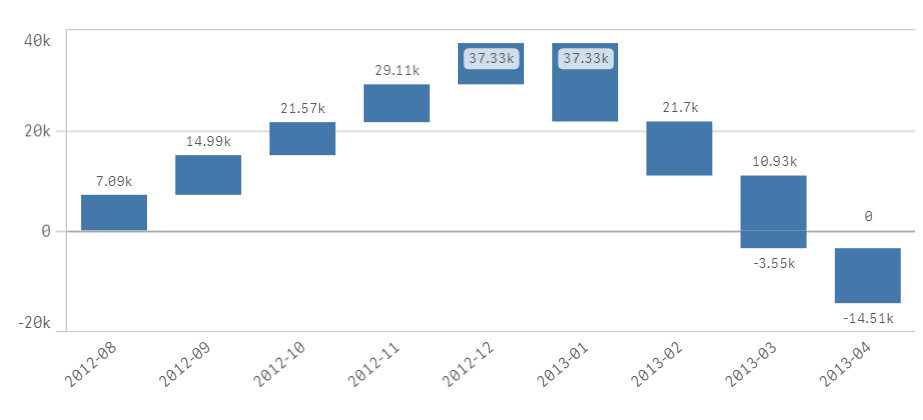
Waterfall Chart (1 dimension, 1 measure)
It gets much more difficult to draw this has to be a waterfall chart. There is no real "bar offset" to the axis, so in reality there has to be a bar segment for the offset with the color set to transparent.
This is doable, but the formula is really complex to explain.
- Put your chart expression into a variable e.g. "vExpr1"
- Create a bar chart with two dimensions
- your main dimension (in above example it is YearMonth)
- a caluclated pseudo dimension with this formula: =ValueList('', ' ', ' ') Label this dimension with a space (=invisible label)
- Add the following expression, where $(Expr1) is your chart expression:
- Pick(RowNo()
, RangeMax(0, RangeSum(Above(TOTAL If(RowNo()=1,$(vExpr1)),0,RowNo(TOTAL))) - RangeMax(0, $(vExpr1)))
+ RangeMin(0, RangeSum(Above(TOTAL If(RowNo()=1,$(vExpr1)),0,RowNo(TOTAL))) - RangeMin(0, $(vExpr1)))
,Fabs(RangeMax(0, RangeSum(Above(TOTAL If(RowNo()=1,$(vExpr1)),0,RowNo(TOTAL))))
- RangeMax(0, RangeSum(Above(TOTAL If(RowNo()=1,$(vExpr1)),3,RowNo(TOTAL)))))
,-Fabs(RangeMin(0, RangeSum(Above(TOTAL If(RowNo()=1,$(vExpr1)),0,RowNo(TOTAL))))
- RangeMin(0, RangeSum(Above(TOTAL If(RowNo()=1,$(vExpr1)),3,RowNo(TOTAL)))))
)
- Pick(RowNo()
- Add this formula in the color by expression formula:
- If(RowNo()=1, ARGB(0,0,0,0), RGB(68,119,170))
The RGB color code is the Dark Blue of the Qlik Sense standard theme, feel free to change it.
- Mark as New
- Bookmark
- Subscribe
- Mute
- Subscribe to RSS Feed
- Permalink
- Report Inappropriate Content
Hi Christof,
the instructions work great. However for the 2 dimension cumulative chart, I am unable to show to visual unless values are selected in the second dimension. Was that a requirement for the cumulative chart to work?
- Mark as New
- Bookmark
- Subscribe
- Mute
- Subscribe to RSS Feed
- Permalink
- Report Inappropriate Content
Dear Christof,
Thanks for the formula about the accumulating chart with 2 dimensions.
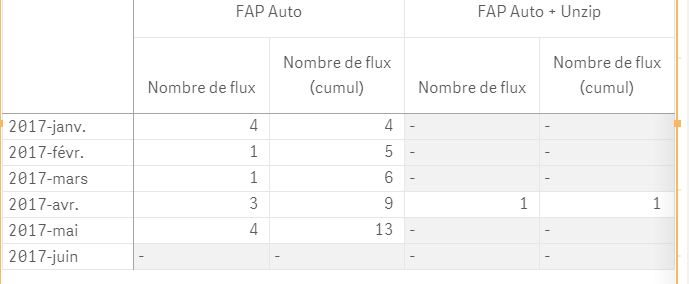
I experience an issue that I cannot fix by myself after several hours of search: when one of the calculated value is null, the chart does not display it at all:
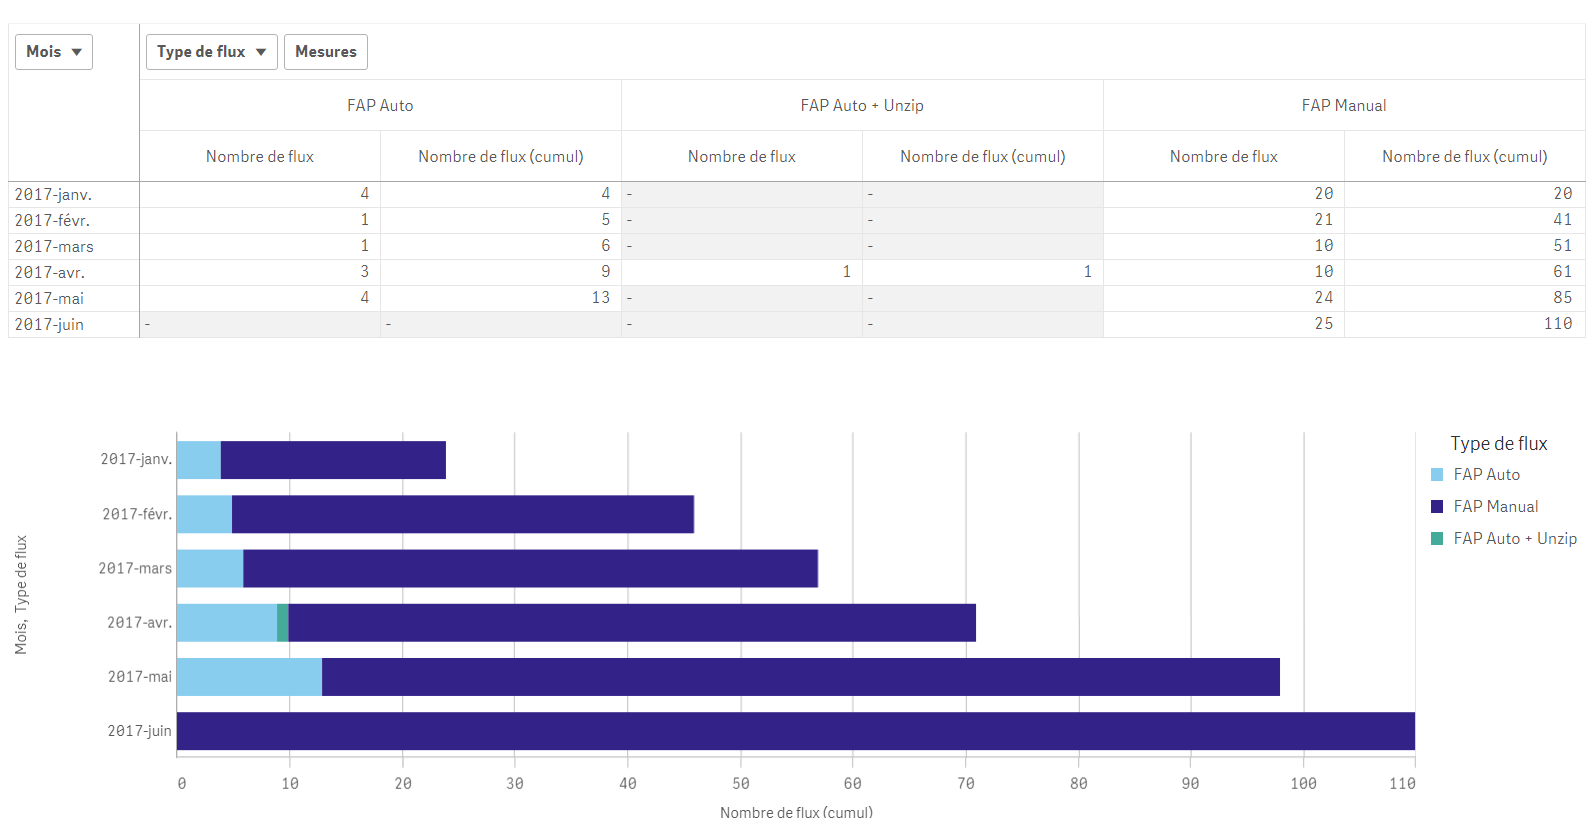
For example for the last month (June), I should keep the "FAP Auto" with the same value as for May.
Is there a way to do it ?
Thanks a lot in advance for your answer.
- Mark as New
- Bookmark
- Subscribe
- Mute
- Subscribe to RSS Feed
- Permalink
- Report Inappropriate Content
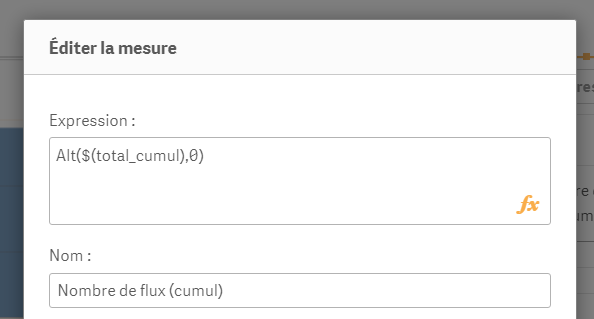
Maybe try whenever your nullable expression is Xxx(xxx) ... Or a variable $(xxx) use Alt( Xxx(xxx) ,0) or Alt( $(xxx) ,0) instead
Von meinem iPhone gesendet
Am 27.06.2017 um 17:26 schrieb yohann legrand <qcwebmaster@qlikview.com<mailto:qcwebmaster@qlikview.com>>:
- Mark as New
- Bookmark
- Subscribe
- Mute
- Subscribe to RSS Feed
- Permalink
- Report Inappropriate Content
Thanks for your quick answer.
Unfortunately, it does not work either: it seems that the expression is not evaluated at all (cf screenshot).
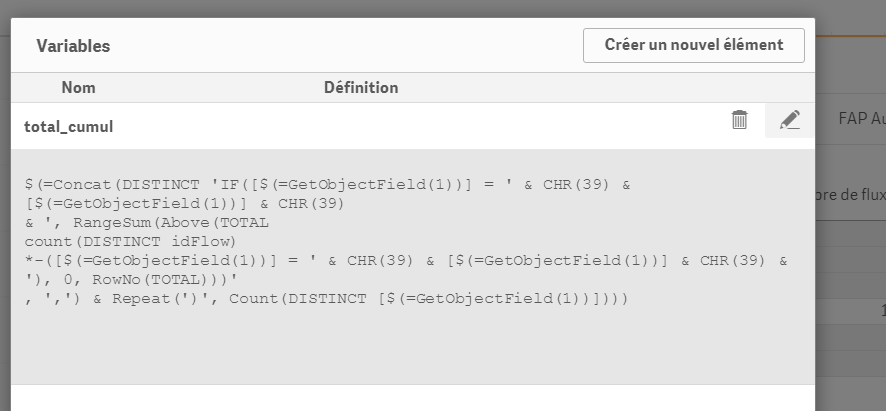
Whatever the kind of function I use on this variable output (IF / LEN / ALT / etc.), it returns a null when there is no value at all from the input source.
I have the strong feeling that the change has to be done directly within the below expression, but I can't manage to figure out how:
$(=Concat(DISTINCT 'IF([$(=GetObjectField(1))] = ' & CHR(39) & [$(=GetObjectField(1))] & CHR(39)
& ', RangeSum(Above(TOTAL
count(DISTINCT idFlow)
*-([$(=GetObjectField(1))] = ' & CHR(39) & [$(=GetObjectField(1))] & CHR(39) & '), 0, RowNo(TOTAL)))'
, ',') & Repeat(')', Count(DISTINCT [$(=GetObjectField(1))])))
Does it make sense to you?
- Mark as New
- Bookmark
- Subscribe
- Mute
- Subscribe to RSS Feed
- Permalink
- Report Inappropriate Content
Dear Christof,
I am sorry to have to ask you again without extra elements, but do you at least have a clue about a possible adaptation of your formula?
After many tries, I still am not able to adapt it to have the right behavior.
Thanks a lot.
- Mark as New
- Bookmark
- Subscribe
- Mute
- Subscribe to RSS Feed
- Permalink
- Report Inappropriate Content
Hi yohan. What is behind your variable $(total_cum) ... looking at your screenshot it seems that you are using maybe an Aggr() function in this formula. If so, try Aggr(NODISTINCT ....) instead .... this will start to fill up every row. If it is not Aggr but a TOTAL argument, the error is somewhere else. Can you share the entire app?
- Mark as New
- Bookmark
- Subscribe
- Mute
- Subscribe to RSS Feed
- Permalink
- Report Inappropriate Content
Hi Christof,
$(total_cumul) contains your formula as it, just by replacing sum(ExpenseActual) by count(DISTINCT idFlow)
By removing the DISTINCT, it returns totally wrong result :
- The cumul value is about 1000 times the correct value
- It does not correct the problematic behaviour
Correct values (with DISTINCT) :
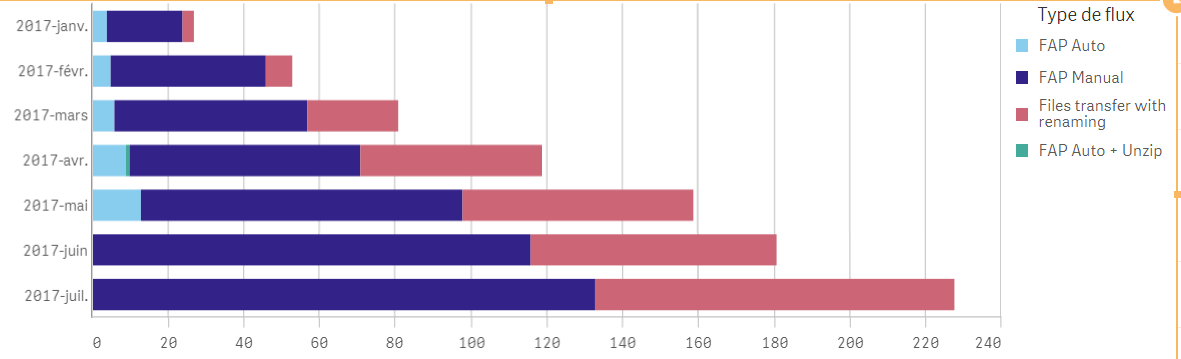
Values without DISTINCT
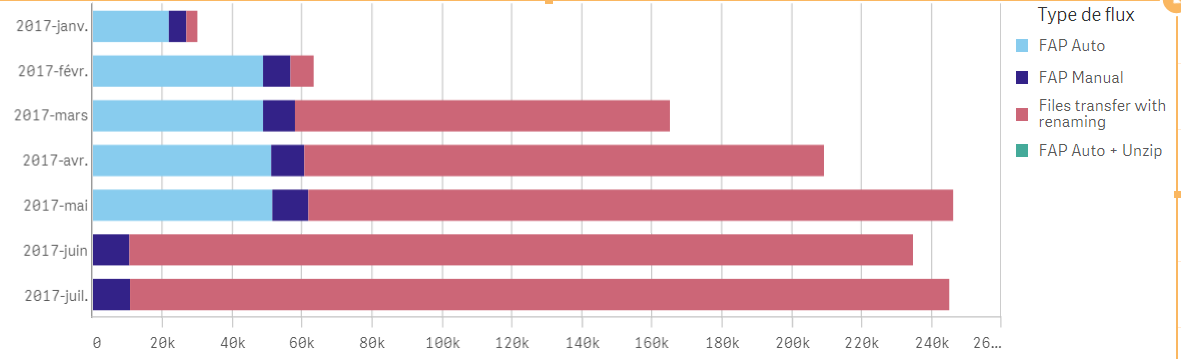
Please find the link to download the full app. The issue is in the bar graph at the bottom of the "Création de flux" sheet : Interlog Sharing
I never tried to share an app. Is it enough or do you need extra files ?
- Mark as New
- Bookmark
- Subscribe
- Mute
- Subscribe to RSS Feed
- Permalink
- Report Inappropriate Content
Looks like my file expired after 7 days. I moved my file to Dropbox to keep it until you have a look: Dropbox - Apps.zip
- Mark as New
- Bookmark
- Subscribe
- Mute
- Subscribe to RSS Feed
- Permalink
- Report Inappropriate Content
Hi Christof Schwarz,
your post is realy helpful, although i am trying to get the last row as total in the waterfall, thus the offset to be 0.
is there a condition possible where we keep the rangesum formula for all except last row.
Regards
Smrati