Unlock a world of possibilities! Login now and discover the exclusive benefits awaiting you.
- Qlik Community
- :
- Forums
- :
- Analytics
- :
- New to Qlik Analytics
- :
- Re: How to use Measure as Dimension in Qlik Sense
- Subscribe to RSS Feed
- Mark Topic as New
- Mark Topic as Read
- Float this Topic for Current User
- Bookmark
- Subscribe
- Mute
- Printer Friendly Page
- Mark as New
- Bookmark
- Subscribe
- Mute
- Subscribe to RSS Feed
- Permalink
- Report Inappropriate Content
How to use Measure as Dimension in Qlik Sense
Hello Every one
i have data for aging analysis app
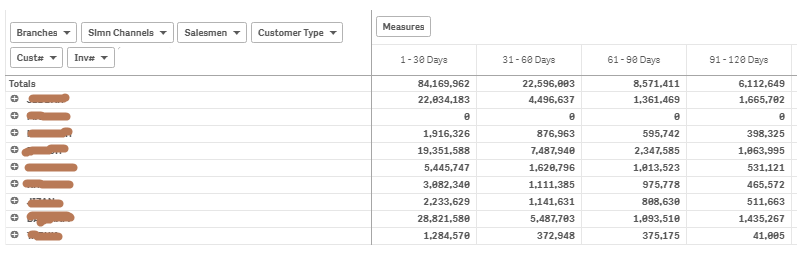
The requirement is to change the measures 1-30days 31-60 days 61 - 90 days as dimensions as filter pane ,. when user select the 1-30 days ..... from the list in filter, the data of that particular selection should display under measures. is therey any one help me in this regard
Thank you
- Mark as New
- Bookmark
- Subscribe
- Mute
- Subscribe to RSS Feed
- Permalink
- Report Inappropriate Content
HI Abu,
You need to create aging bucket like 1-30days,31-60days in script level . so you can use it as a list box.
Thanks,
Arvind Patil
- Mark as New
- Bookmark
- Subscribe
- Mute
- Subscribe to RSS Feed
- Permalink
- Report Inappropriate Content
Hi,
If the ageing buckets are calculated at the time of creating the visualization how can this be achieved?
We have user input as a cut off date and based on the difference between the cut off date and the due date of payment we find out the age of each invoice.
How can we represent this in a pie chart such that each section of pie would show the amount against each bucket?
Thanks,
Saikat
- Mark as New
- Bookmark
- Subscribe
- Mute
- Subscribe to RSS Feed
- Permalink
- Report Inappropriate Content
They wouldn't be created at the time of visualization, they would have to be created as part of the datamodel.
- Mark as New
- Bookmark
- Subscribe
- Mute
- Subscribe to RSS Feed
- Permalink
- Report Inappropriate Content
Hello!
How I would create a ageing bucket?
I have similar problem. I have two measures, but I want they could be selected in a filter pane, to can show only one sometimes. And now always show the both in the table.
Thanks and regards.