Unlock a world of possibilities! Login now and discover the exclusive benefits awaiting you.
- Qlik Community
- :
- All Forums
- :
- QlikView App Dev
- :
- Re: Return Most Recent Obs
- Subscribe to RSS Feed
- Mark Topic as New
- Mark Topic as Read
- Float this Topic for Current User
- Bookmark
- Subscribe
- Mute
- Printer Friendly Page
- Mark as New
- Bookmark
- Subscribe
- Mute
- Subscribe to RSS Feed
- Permalink
- Report Inappropriate Content
Return Most Recent Obs
Hi,
I'm working with a synthetic data set in an EAV format, entity-attribute-value. I'd like to return the most recent health measure name and value for each individual. Item level is the base table that I loaded in, I want to have a second table that just shows the most recent.
Here's a sample:
| ID | Gender | age | value | healthMeasure | obsMonth |
| 1 | Female | 18 | 9 | ESS_score | 3 |
| 1 | Female | 18 | 108 | ANAM | 4 |
| 1 | Female | 18 | No | BP_hypertensive | 9 |
| 1 | Female | 18 | No | BP_hypertensive | 6 |
| 1 | Female | 18 | Yes | appropriateScreen | 6 |
| 1 | Female | 18 | Yes | appropriateScreen | 9 |
| 1 | Female | 18 | Good | cardioTest | 10 |
So for person with ID one, ideally I would have 5 rows, dropping the ones with BP hypertensive and month 6 and appropriate screen and month 6. (This data set has 100s of people in it...)
What I have hasn't been working:
[MostRecentObs]:
Load
ID,
ObsMonth,
Gender,
Age,
healthMeasure,
value
Resident ItemLevel
where ObsMonth= max(ObsMonth)
Group by ID,
Gender,
"age",
healthMeasure
Any help would be appreciated!
Best,
Tanya
Accepted Solutions
- Mark as New
- Bookmark
- Subscribe
- Mute
- Subscribe to RSS Feed
- Permalink
- Report Inappropriate Content
Hi Tanya,
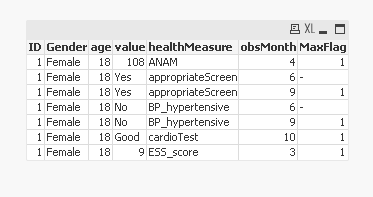
Does this chart give you what you need?
| ID | Gender | age | FirstSortedValue(value,-obsMonth) | healthMeasure | Max(obsMonth) |
|---|---|---|---|---|---|
| 1 | Female | 18 | 108 | ANAM | 4 |
| 1 | Female | 18 | Yes | appropriateScreen | 9 |
| 1 | Female | 18 | No | BP_hypertensive | 9 |
| 1 | Female | 18 | Good | cardioTest | 10 |
| 1 | Female | 18 | 9 | ESS_score | 3 |
Cheers
Andrew
- Mark as New
- Bookmark
- Subscribe
- Mute
- Subscribe to RSS Feed
- Permalink
- Report Inappropriate Content
May be this
Table:
LOAD ID,
Gender,
age,
value,
healthMeasure,
obsMonth
FROM
[https://community.qlik.com/thread/268946]
(html, codepage is 1252, embedded labels, table is @1);
Right Join (Table)
LOAD ID,
Gender,
age,
healthMeasure,
Max(obsMonth) as obsMonth
Resident Table
Group By ID, Gender, age, healthMeasure;
- Mark as New
- Bookmark
- Subscribe
- Mute
- Subscribe to RSS Feed
- Permalink
- Report Inappropriate Content
Maybe like this
[MostRecentObs]:
Load
ID,
Gender,
    Age,
    healthMeasure,
    value,
    max(ObsMonth) as ObsMonth

Resident ItemLevel Group by ID,Gender,Age,healthMeasure,value;
- Mark as New
- Bookmark
- Subscribe
- Mute
- Subscribe to RSS Feed
- Permalink
- Report Inappropriate Content
I've tried that and it returns all rows.
- Mark as New
- Bookmark
- Subscribe
- Mute
- Subscribe to RSS Feed
- Permalink
- Report Inappropriate Content
Hi Tanya,
Does this chart give you what you need?
| ID | Gender | age | FirstSortedValue(value,-obsMonth) | healthMeasure | Max(obsMonth) |
|---|---|---|---|---|---|
| 1 | Female | 18 | 108 | ANAM | 4 |
| 1 | Female | 18 | Yes | appropriateScreen | 9 |
| 1 | Female | 18 | No | BP_hypertensive | 9 |
| 1 | Female | 18 | Good | cardioTest | 10 |
| 1 | Female | 18 | 9 | ESS_score | 3 |
Cheers
Andrew
- Mark as New
- Bookmark
- Subscribe
- Mute
- Subscribe to RSS Feed
- Permalink
- Report Inappropriate Content
Yes, that's it! I've gotten close with the reply from Sunny Talwar, however, that solution doesn't limit the records down to only to return the max obs record as your does. My solution was to create an additional table with a where clause when obsmonth=max(obsmonth) but I haven't been able to get that to work, for some reason no other tables are being produced after that join, am I missing a semi colon somewhere?
The other issue this introduces is that Qlik is creating a synthetic key on obsmonth which doesn't really make sense, I would like to relate the tables but use ID instead.
Thanks much for any assistance!
Tanya
- Mark as New
- Bookmark
- Subscribe
- Mute
- Subscribe to RSS Feed
- Permalink
- Report Inappropriate Content
May be create a flag for the max Month?
- Mark as New
- Bookmark
- Subscribe
- Mute
- Subscribe to RSS Feed
- Permalink
- Report Inappropriate Content
Hi Tanya,
Glad to be of help. Once you're sure you've got the answer you need please close the thread close by marking a response as correct and if you're feeling generous you can also the mark responses of those who have helped as helpful.
Cheers
Andrew
- Mark as New
- Bookmark
- Subscribe
- Mute
- Subscribe to RSS Feed
- Permalink
- Report Inappropriate Content
Hi Andrew,
Could you provide the code you used to produce the table in your last post?
Best,
Tanya