Unlock a world of possibilities! Login now and discover the exclusive benefits awaiting you.
- Qlik Community
- :
- All Forums
- :
- QlikView App Dev
- :
- Re: Sequential number instead of Dimension values
- Subscribe to RSS Feed
- Mark Topic as New
- Mark Topic as Read
- Float this Topic for Current User
- Bookmark
- Subscribe
- Mute
- Printer Friendly Page
- Mark as New
- Bookmark
- Subscribe
- Mute
- Subscribe to RSS Feed
- Permalink
- Report Inappropriate Content
Sequential number instead of Dimension values
Hi,
I am working on a line chart which has ID on X-axis and "no of days open" on Y-axis.

I am trying to name these IDs in numbers like this-
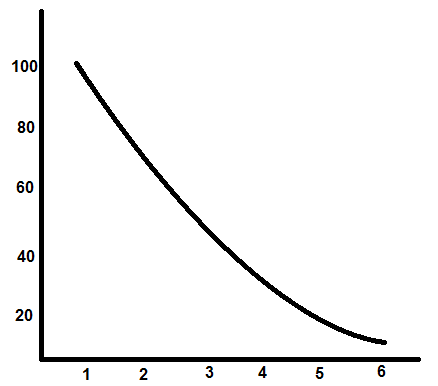
Any idea as to how to name these IDs in numbers?
- « Previous Replies
- Next Replies »
- Mark as New
- Bookmark
- Subscribe
- Mute
- Subscribe to RSS Feed
- Permalink
- Report Inappropriate Content
This?
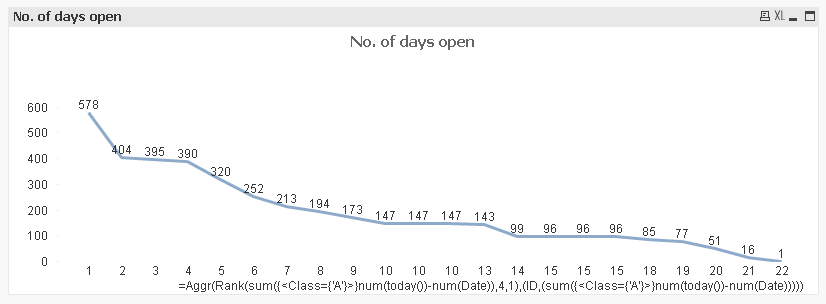
Exp (using sortable aggr()):
=Aggr(Rank(sum({<Class={'A'}>}num(today())-num(Date)),4,1),(ID,(sum({<Class={'A'}>}num(today())-num(Date)))))
- Mark as New
- Bookmark
- Subscribe
- Mute
- Subscribe to RSS Feed
- Permalink
- Report Inappropriate Content
Hi Tresesco,
This is brilliant! Thank you so much!
Just 1 tiny thing - Is it possible to show only distinct values in here? I tried using distinct, but couldn't get it right. 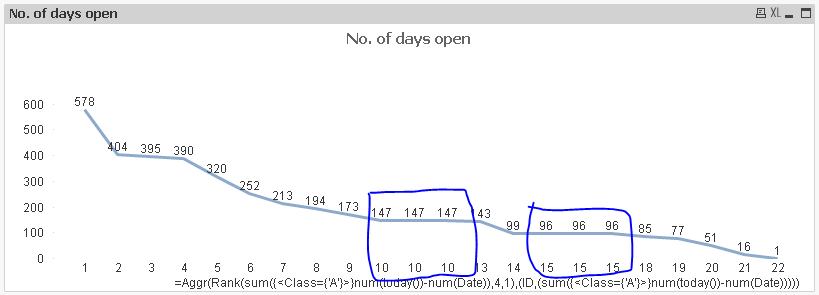
- Mark as New
- Bookmark
- Subscribe
- Mute
- Subscribe to RSS Feed
- Permalink
- Report Inappropriate Content
Or is it possible to number them 10,11,12 instead of 10, 10, 10?
- Mark as New
- Bookmark
- Subscribe
- Mute
- Subscribe to RSS Feed
- Permalink
- Report Inappropriate Content
Putting Num() around like:
=Aggr(Num(Rank(sum({<Class={'A'}>}num(today())-num(Date)),4)),(ID, (Num(Rank(sum({<Class={'A'}>}num(today())-num(Date)),4)))))
Should have worked, but for some reason (I could not find out yet) few overlapped ranks are not getting sorted that way.
- Mark as New
- Bookmark
- Subscribe
- Mute
- Subscribe to RSS Feed
- Permalink
- Report Inappropriate Content
Tresesco,
Ok, I will give it a try.
Thank you very much.
- Mark as New
- Bookmark
- Subscribe
- Mute
- Subscribe to RSS Feed
- Permalink
- Report Inappropriate Content
Hi Tresesco,
This is exactly what I was looking for, it worked perfectly for me. Thank you so much!
=Aggr(Num(Rank(sum({<Class={'A'}>}num(today())-num(Date)),4)),(ID, (Num(Rank(sum({<Class={'A'}>}num(today())-num(Date)),4)))))
- « Previous Replies
- Next Replies »