Unlock a world of possibilities! Login now and discover the exclusive benefits awaiting you.
- Qlik Community
- :
- All Forums
- :
- QlikView App Dev
- :
- Using "if" in an expression : how to have distinct...
- Subscribe to RSS Feed
- Mark Topic as New
- Mark Topic as Read
- Float this Topic for Current User
- Bookmark
- Subscribe
- Mute
- Printer Friendly Page
- Mark as New
- Bookmark
- Subscribe
- Mute
- Subscribe to RSS Feed
- Permalink
- Report Inappropriate Content
Using "if" in an expression : how to have distinct values ?
Good day,
I have the following data :
Data:
LOAD * INLINE [
Country, City, Value
France, Paris, 1
France, Lyon, 2
USA, Washington, 4
USA, New York, 8
Japan, Tokyo, 16
];
I'm using a separate table to manage geography :
Geography:
LOAD DISTINCT
Country AS Country_dim,
City AS City_dim
RESIDENT Data;
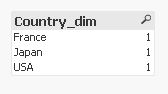
When I do a simple graph using the "Country" dimension, I have the following correct result :
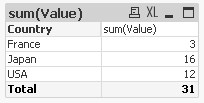
with a "sum(Value)" formula.
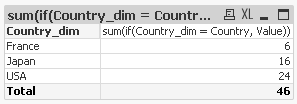
When I do more complex graphics, I need to use the "Country_dim" dimension as graph dimension (instead of "Country"), using a "if" in my expression
sum(if(Country_dim = Country, Value))
Because "Country_dim" have a frequency > 1, I have the wrong values :
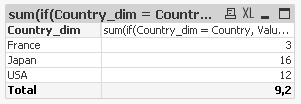
The solution I found is to make a division :
sum(if(Country_dim = Country, Value))
/
count(Country_dim)
but my total goes wrong :
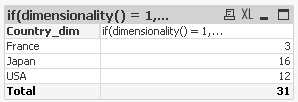
So, I'm using a more complex formula as workaround :
if(dimensionality() = 1,
sum(if(Country_dim = Country, Value))
/
count(Country_dim),
if(dimensionality() = 0,
sum(Value)
)
)
that gives me the expected result :
BUT, this workaround can give me very very complex formulas when I have to use many dimensions, and this formulas can be very very long to compute (because the "if" make a calculation of every pieces of formula).
Is there a way to say "I want to make my test on the distinct values of Country_dim" ?
I hoped that "sum(if(only(Country_dim) = Country, Value))" would work, but it doesn't.
- « Previous Replies
-
- 1
- 2
- Next Replies »
- Mark as New
- Bookmark
- Subscribe
- Mute
- Subscribe to RSS Feed
- Permalink
- Report Inappropriate Content
Hi Nicolas,
Would an easier workaround be to have separate tables for your dimensions? As in:
Geography_Country:
LOAD
DISTINCT Country AS Country_dim
RESIDENT Data;
Geography_City:
LOAD
DISTINCT City AS City_dim
RESIDENT Data;
That gives me:
and
Regards,
Chris
- Mark as New
- Bookmark
- Subscribe
- Mute
- Subscribe to RSS Feed
- Permalink
- Report Inappropriate Content
Hello Nicolas,
In the "Wrong Values" chart set Country as dimension instead of Country_dim and the following as expression
Sum({< Country = P(Country_dim) >} Value)
The P() function gets all possible values of the field passed as parameter (Contry_dim). The whole comparison is called set analysis (between curly brackets). You need to do it this way because the Value field is related to the Country dimension, and because the expression aggregates in regards to the value in the dimension.
Hope that helps.
BI Consultant
- Mark as New
- Bookmark
- Subscribe
- Mute
- Subscribe to RSS Feed
- Permalink
- Report Inappropriate Content
Ah, pictures missing!
and

- Mark as New
- Bookmark
- Subscribe
- Mute
- Subscribe to RSS Feed
- Permalink
- Report Inappropriate Content
In my example, there is only 1 dimension.
In real life, I have more than 1 dimension, and dimensions are related ("Country", "City", ...).
If I use separate tables, I have to add a lot of conditions to filter the data.
Something like
sum({$ <Country=P(Country_dim), City=P(City_dim)>} if(City_dim = City and Country_dim = Country, Value))
- Mark as New
- Bookmark
- Subscribe
- Mute
- Subscribe to RSS Feed
- Permalink
- Report Inappropriate Content
Miguel Angel Baeyens a écrit:
Hello Nicolas,
In the "Wrong Values" chart set Country as dimension instead of Country_dim and the following as expression
Sum({< Country = P(Country_dim) >} Value)
This is not what I need.
If I could use the "Country" dimension in my graph, I would. But in my question, I can't.
(in my real application, my expression are far more complex with set analysis, but I prefer to post a "simple" question not explaining my whole application. Fact is : I have to use "Country_dim" as dimension)
Moreover, if I use "Country" as dimension and "Sum({$ < Country = P(Country_dim) >} Value)" as expression, the user can no more make his selection directly in the graph.
- Mark as New
- Bookmark
- Subscribe
- Mute
- Subscribe to RSS Feed
- Permalink
- Report Inappropriate Content
Hi Nicholas,
I've attached the qvd I have amended. I have only made changes in the script, I have not made any changes to the formula you have used.
Hopefully that gives you a better idea of what I have done rather than the 2 pictures and bit of code.
Regards,
Chris
- Mark as New
- Bookmark
- Subscribe
- Mute
- Subscribe to RSS Feed
- Permalink
- Report Inappropriate Content
Hi,
Again, tables are not linked, so the aggregation is not likely to work as expected unless some relationship is established between them.
Anyway, a very poor implementation that is likely to work is as follows:
Sum(DISTINCT Value * (Country_dim=Country) * -1)
DISTINCT will not sum Values if they are duplicated (on for each Country / Country_dim value). The parenthesis will return -1 (true) if the are the same, and multiplied by -1 again to get the proper result.
Hope that helps.
BI Consultant
- Mark as New
- Bookmark
- Subscribe
- Mute
- Subscribe to RSS Feed
- Permalink
- Report Inappropriate Content
Miguel Angel Baeyens a écrit:
Again, tables are not linked, so the aggregation is not likely to work as expected unless some relationship is established between them.
Anyway, a very poor implementation that is likely to work is as follows:
Sum(DISTINCT Value * (Country_dim=Country) * -1)
DISTINCT will not sum Values if they are duplicated (on for each Country / Country_dim value). The parenthesis will return -1 (true) if the are the same, and multiplied by -1 again to get the proper result.
If I use master tables, it is because I don't want to have relation between my tables !
With your solution, if I replace
France, Paris, 1
with
France, Paris, 0.5
France, Paris, 0.5
my result are false...
I cannot assure that there is not 2 values alike in my data.
- Mark as New
- Bookmark
- Subscribe
- Mute
- Subscribe to RSS Feed
- Permalink
- Report Inappropriate Content
Hi Miguel,
I see what you are saying now, it took a while to sink in.
My first idea was that Nicolas may be looking for data islands to get around the problem he is having.
Obviously you will have more experience with this than me as I've only been using QlikView for 9 months so you will be able to warn of all of the pitfalls and things to bear in mind when doing this!
Regards,
Chris
- « Previous Replies
-
- 1
- 2
- Next Replies »